- Analisis
- Analisis teknis
Jagung Analisis teknis - Jagung Jual beli: 2016-10-28
Healthy demand for ethanol production supports corn
Corn price advances with managed funds building long positions and ethanol production providing additional support. Will the price of corn continue rising?
Corn prices had been rising ahead of the US Department of Agriculture’s Weekly Export Sales report. Two weeks ago the October World Agricultural Supply and Demand Estimates report revised downward the US corn production 36 million bushels from the September WASDE forecast to 15.06 billion bushels in marketing year 2016-17. Domestic use numbers remained unchanged from the September forecast, which boosted corn prices. Analysts note that currently purchases by managed money funds as they rotate out of equities with stocks trading in narrow range provide additional support to grains. Another bullish factor for corn is healthy demand for corn by US ethanol producers with weekly ethanol production up 3.1% from the same period a year earlier. Today the US Department of Agriculture’s Weekly Export Sales report will be released, which may affect corn prices depending on US corn export performance and forecasts.
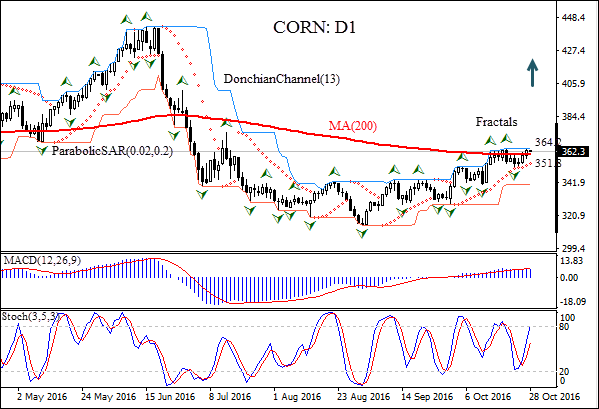
On the daily timeframe CORN:D1 has been rising after hitting multi-year low at the end of August. The price has closed above the 200-day moving average MA(200).
- The Donchian channel is flat: no trend is indicated.
- The Parabolic indicator gives a buy signal.
- The MACD indicator is above the signal line and the gap is rising, which is a bullish signal.
- The stochastic oscillator is rising and but hasn’t reached the overbought zone yet.
We believe breaching above the last fractal high at 364.2, confirmed also by the upper Donchian boundary, will signify continuation of the bullish momentum. It can be used as an entry point and a pending order to buy can be placed above that level. The stop loss can be placed below the last fractal low at 351.8. After placing the pending order the stop loss is to be moved every day following Parabolic signals. Thus, we are changing the probable profit/loss ratio to the breakeven point. If the price meets the stop loss level (351.8) without reaching the order (364.2), we recommend cancelling the position: the market sustains internal changes which were not taken into account.
Technical Analysis Summary
| Position | Buy |
| Buy stop | Above 364.2 |
| Stop loss | Below 351.8 |
- Get Certificate

Perhatian:
Tinjauan ini memiliki karakter informatif dan tutorial dan dipublikasikan secara gratis. Semua data, termasuk dalam Tinjauan, diterima dari sumber publik, diakui kurang lebih dapat diandalkan. Apalagi, tidak ada jaminan bahwa informasi yang ditunjukkan penuh dan tepat. tinjauan tidak diperbarui. Keseluruhan informasi dalam setiap tinjauan, termasuk pendapat, indikator, grafik dan hal lainnya, disediakan hanya untuk tujuan pengenalan dan bukan saran keuangan atau rekomendasi. Seluruh teks dan bagiannya, serta grafik tidak dapat dianggap sebagai tawaran untuk membuat kesepakatan dengan aset apa pun. Pasar IFC dan karyawannya dalam kondisi apapun tidak bertanggung jawab atas tindakan yang dilakukan oleh orang lain selama atau setelah membaca tinjauan.
