- Analisis
- Analisis teknis
Dow Jones Analisis teknis - Dow Jones Jual beli: 2016-08-23
Fed rate hike may weigh on stocks
The Fed talks on possible rate hikes affect the US stocks. The Fed Chair Janet Yellen will speak on Friday where she may comment on possible changes in monetary policy. Higher rates raise the credit burden on the US corporations. Will the Dow Jones industrial average edge lower?
The US corporate earnings season for Q2 2016 is coming to an end. Only 20 companies from S&P 500 index have not yet reported earnings. The quarterly income of S&P 500 components is 0.5% lower while earnings are 2.3% lower so far. The energy and materials sectors showed the record slump in earnings of 84.4% and 7.2% respectively. In theory, investors may decide that financial performance of industrial companies are not in line with their high capitalization. Dow index hit a fresh historical high last week. Now its Р/Е ratio is 19.2 which is far above the historical average of 14. The forward 12-month Р/Е ratio for the S&P 500 is 17.5 and 24-month is 15.4. As we see, they are above the mean. Majority of market participants expect the blended earnings to increase by 8% in Q4 this year. In such a case Р/Е will fall to the forecasted levels.
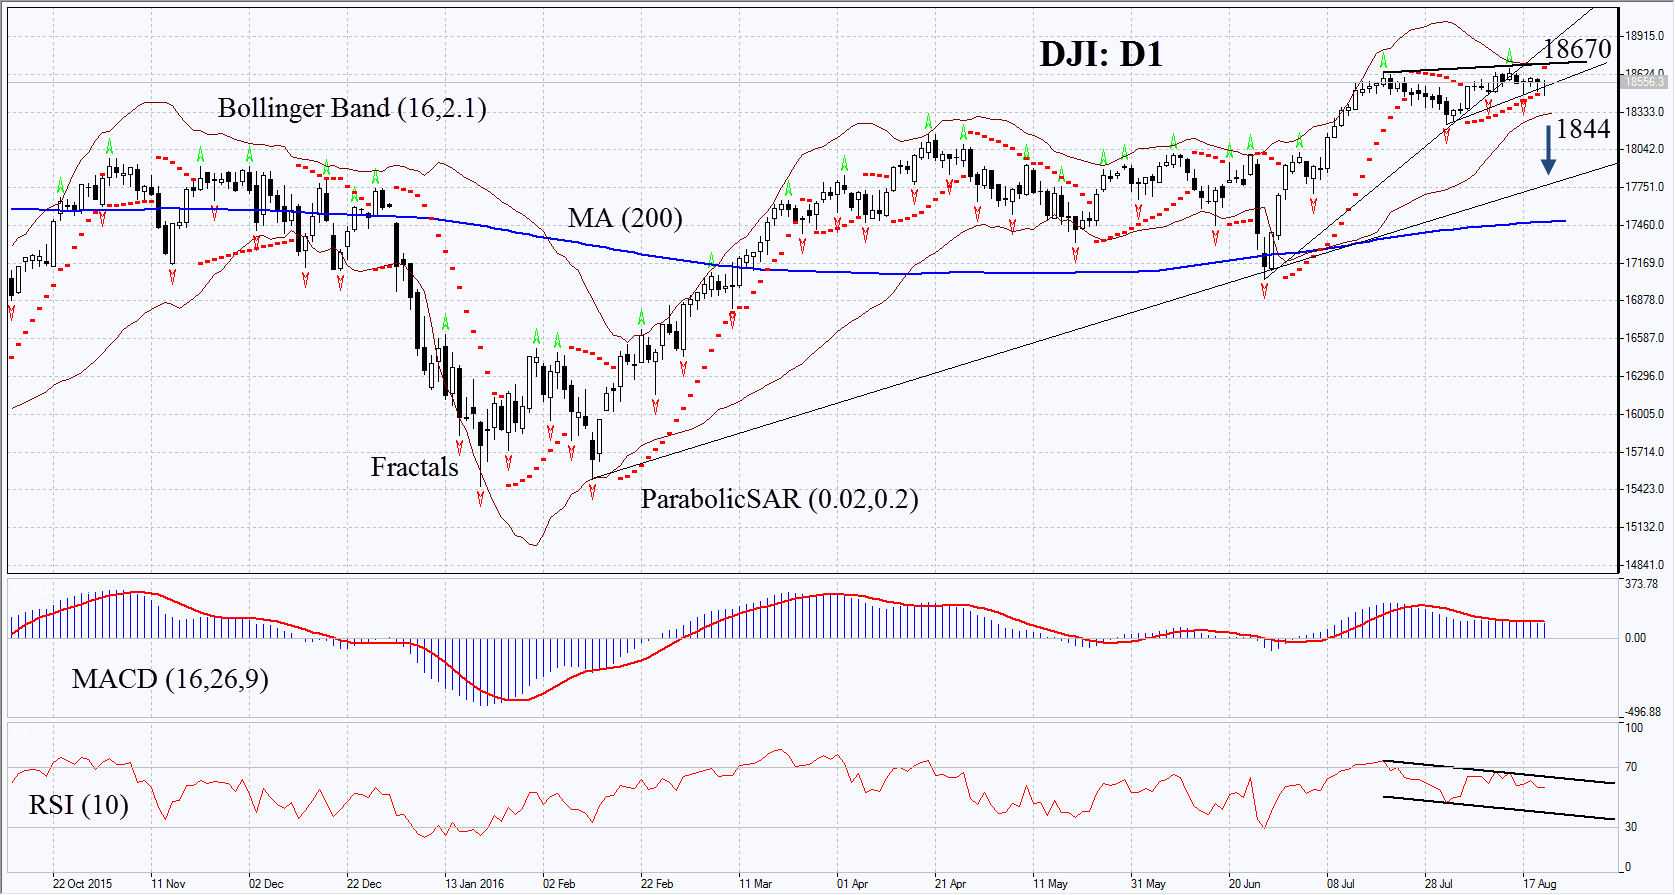
On the daily chart DJI: D1 is in triangle and has approached its lower boundary. The MACD and Parabolic indicators have formed signals to sell. The Bollinger bands have narrowed a lot which means low volatility. RSI is above 50 having formed negative divergence. The bearish momentum may develop in case the Dow falls below the three last fractal lows and the Bollinger Band at 18244. This level may serve the point of entry. The initial stop-loss may be placed above the historical high, the Parabolic and Bollinger signals and the last fractal high at 18670. Having opened the pending order we shall move the stop to the next fractal high following the Parabolic and Bollinger signals. Thus, we are changing the probable profit/loss ratio to the breakeven point. The most risk-averse traders may switch to the 4-hour chart after the trade and place there a stop-loss moving it in the direction of the trade. If the price meets the stop-loss level at 18244 without reaching the order at 18670, we recommend cancelling the position: the market sustains internal changes which were not taken into account.
| Position | Sell |
| Sell stop | below 18244 |
| Stop loss | above 18670 |
- Get Certificate

Perhatian:
Tinjauan ini memiliki karakter informatif dan tutorial dan dipublikasikan secara gratis. Semua data, termasuk dalam Tinjauan, diterima dari sumber publik, diakui kurang lebih dapat diandalkan. Apalagi, tidak ada jaminan bahwa informasi yang ditunjukkan penuh dan tepat. tinjauan tidak diperbarui. Keseluruhan informasi dalam setiap tinjauan, termasuk pendapat, indikator, grafik dan hal lainnya, disediakan hanya untuk tujuan pengenalan dan bukan saran keuangan atau rekomendasi. Seluruh teks dan bagiannya, serta grafik tidak dapat dianggap sebagai tawaran untuk membuat kesepakatan dengan aset apa pun. Pasar IFC dan karyawannya dalam kondisi apapun tidak bertanggung jawab atas tindakan yang dilakukan oleh orang lain selama atau setelah membaca tinjauan.
