- Analisis
- Analisis teknis
GBP/USD Analisis teknis - GBP/USD Jual beli: 2016-08-25
Significant data to come out in Britain
On Friday August 26 not only the Janet Yellen’s speech will grab investor attention as several significant indicators will come out in UK. Will the British pound continue strengthening? It rose 1.3% against the US dollar this week while last week it advanced 1.2%.
Positive data support this trend. Investors could have overvalued the negative effect from the Brexit from EU. On Tuesday the strong report by the big British housebuilding company Persimmon for July came out, the reservation rate rose by 17%. Moreover, the economic report from CBI Trends showed the improved balance of British factory orders. The inflation and retail sales data for June came out better that expected last week. This Friday at 10-30 СЕSТ the GDP in 2nd reading, external trade and business investment indicators for Q2 2016 will come out as well as the index of services for June. In Q1 this year the British economy rose 2% year over year. The Q2 GDP in 1st reading was 2.2%. If it comes the same or higher in 2nd reading this may have a positive impact on British pound.
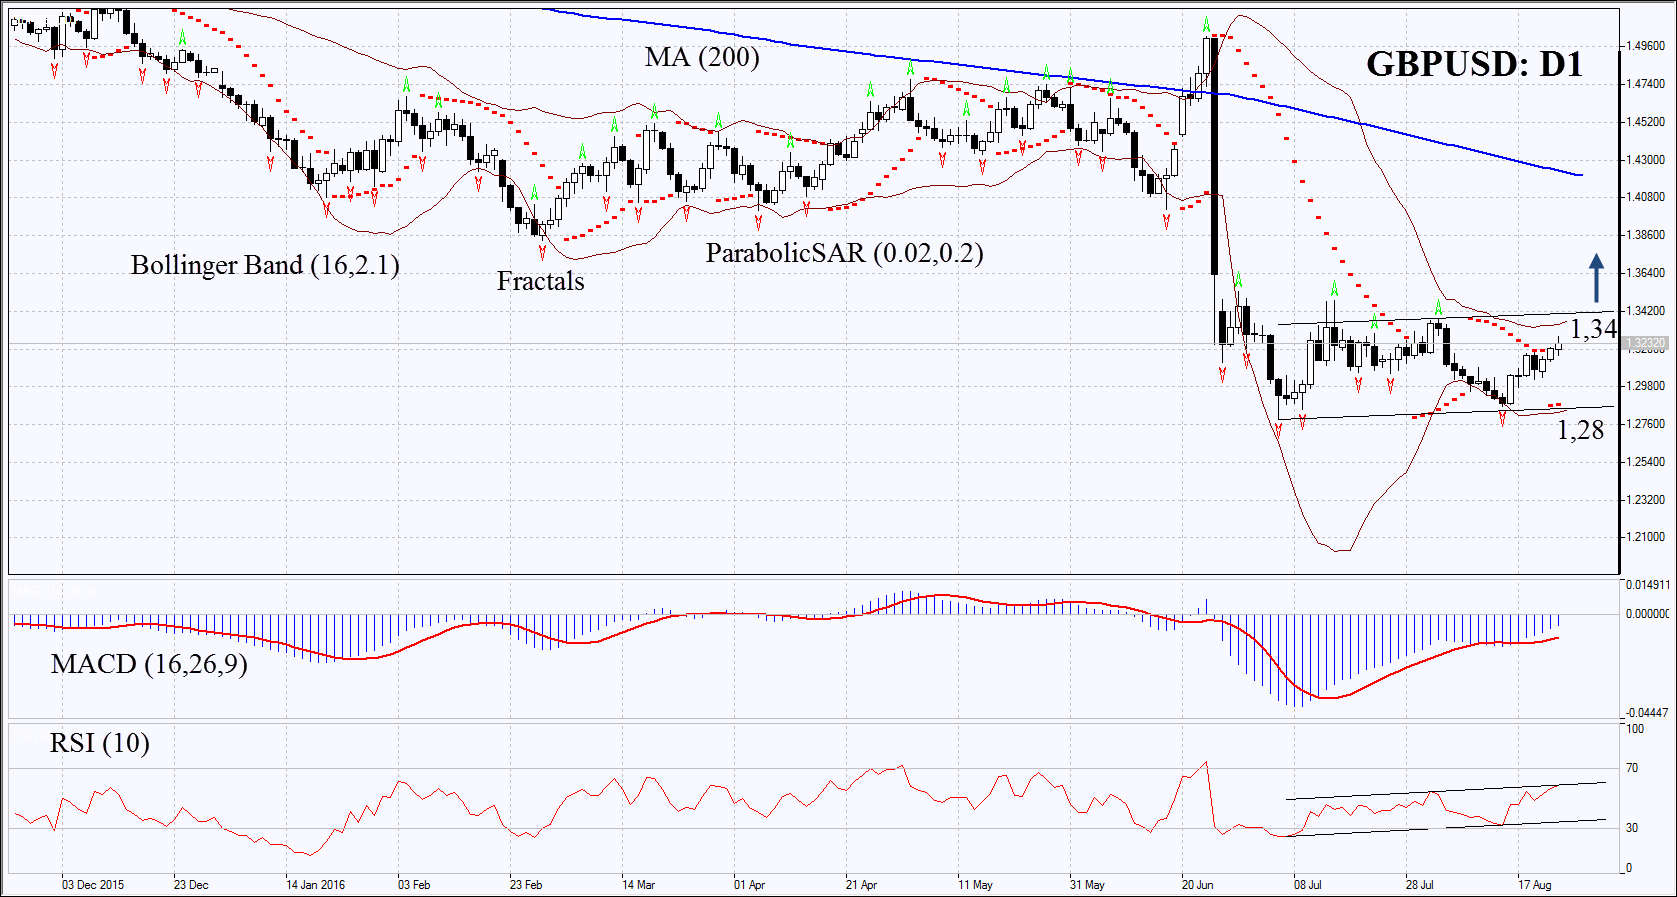
On the daily chart GBPUSD: D1 has fallen a lot after UK decided to leave the EU as a result of the referendum on June 23, 2016 and hit a low since 1985. Now it is approaching the upper boundary of the flat channel. The MACD and Parabolic indicators have formed signals to buy. The Bollinger bands have narrowed which means lower volatility. They are tilted upwards. RSI has left the oversold zone and surpassed the level of 50. RSI is in rising trend but has not yet reached the overbought zone. The bullish momentum may develop in case the British pound surpasses the last fractal high, the Bollinger band and the upper boundary of the ftal channel at 1.34. This level may serve the point of entry. The initial stop-loss may be placed below the low since 1985, the Parabolic signal and the lower Bollinger band at 1.28. Having opened the pending order we shall move the stop to the next fractal low following the Parabolic and Bollinger signals. Thus, we are changing the probable profit/loss ratio to the breakeven point. The most risk-averse traders may switch to the 4-hour chart after the trade and place there a stop-loss moving it in the direction of the trade. If the price meets the stop-loss level at 1.28 without reaching the order at 1.34, we recommend cancelling the position: the market sustains internal changes which were not taken into account.
| Position | Buy |
| Buy stop | above 1.34 |
| Stop loss | below 1.28 |
- Get Certificate

Perhatian:
Tinjauan ini memiliki karakter informatif dan tutorial dan dipublikasikan secara gratis. Semua data, termasuk dalam Tinjauan, diterima dari sumber publik, diakui kurang lebih dapat diandalkan. Apalagi, tidak ada jaminan bahwa informasi yang ditunjukkan penuh dan tepat. tinjauan tidak diperbarui. Keseluruhan informasi dalam setiap tinjauan, termasuk pendapat, indikator, grafik dan hal lainnya, disediakan hanya untuk tujuan pengenalan dan bukan saran keuangan atau rekomendasi. Seluruh teks dan bagiannya, serta grafik tidak dapat dianggap sebagai tawaran untuk membuat kesepakatan dengan aset apa pun. Pasar IFC dan karyawannya dalam kondisi apapun tidak bertanggung jawab atas tindakan yang dilakukan oleh orang lain selama atau setelah membaca tinjauan.
