- Analisis
- Analisis teknis
GBP/USD Analisis teknis - GBP/USD Jual beli: 2016-10-27
Brexit may soften
UK Brexit Minister David Jones said the country’s parliament is planning to review a new law on Brexit. Investors believe is to be soft with most of economic relations remaining the same. Amid this British pound strengthened on Wednesday. Will the trend persist?
The main issue which makes uneasy all forex market participants is whether Britain is to remain the part of the single European market. If so, pound may reputedly advance. Another factor which supports pound is the statement by Bank of England head Mark Carney that while making interest rate decision, 18% slump in pound after Brexit is to be considered as weaker pound bears deflation risk. After such a statement most investors believe the Bank of England will not cut interest rate on its next meeting on November 3, 2016. It may remain at the current level of 0.25% till the end of 2017 at least. Bank of England has cut the rate from 0.5% this September for the first time since 2009 to stimulate economic growth. The Q3 2016 GDP data will come out on Thursday in Great Britain. The GDP is expected to remain at the level of Q2 at 2.1% in annual terms. We believe this may be quite positive. The British economy has been expanding for 4 straight years already.
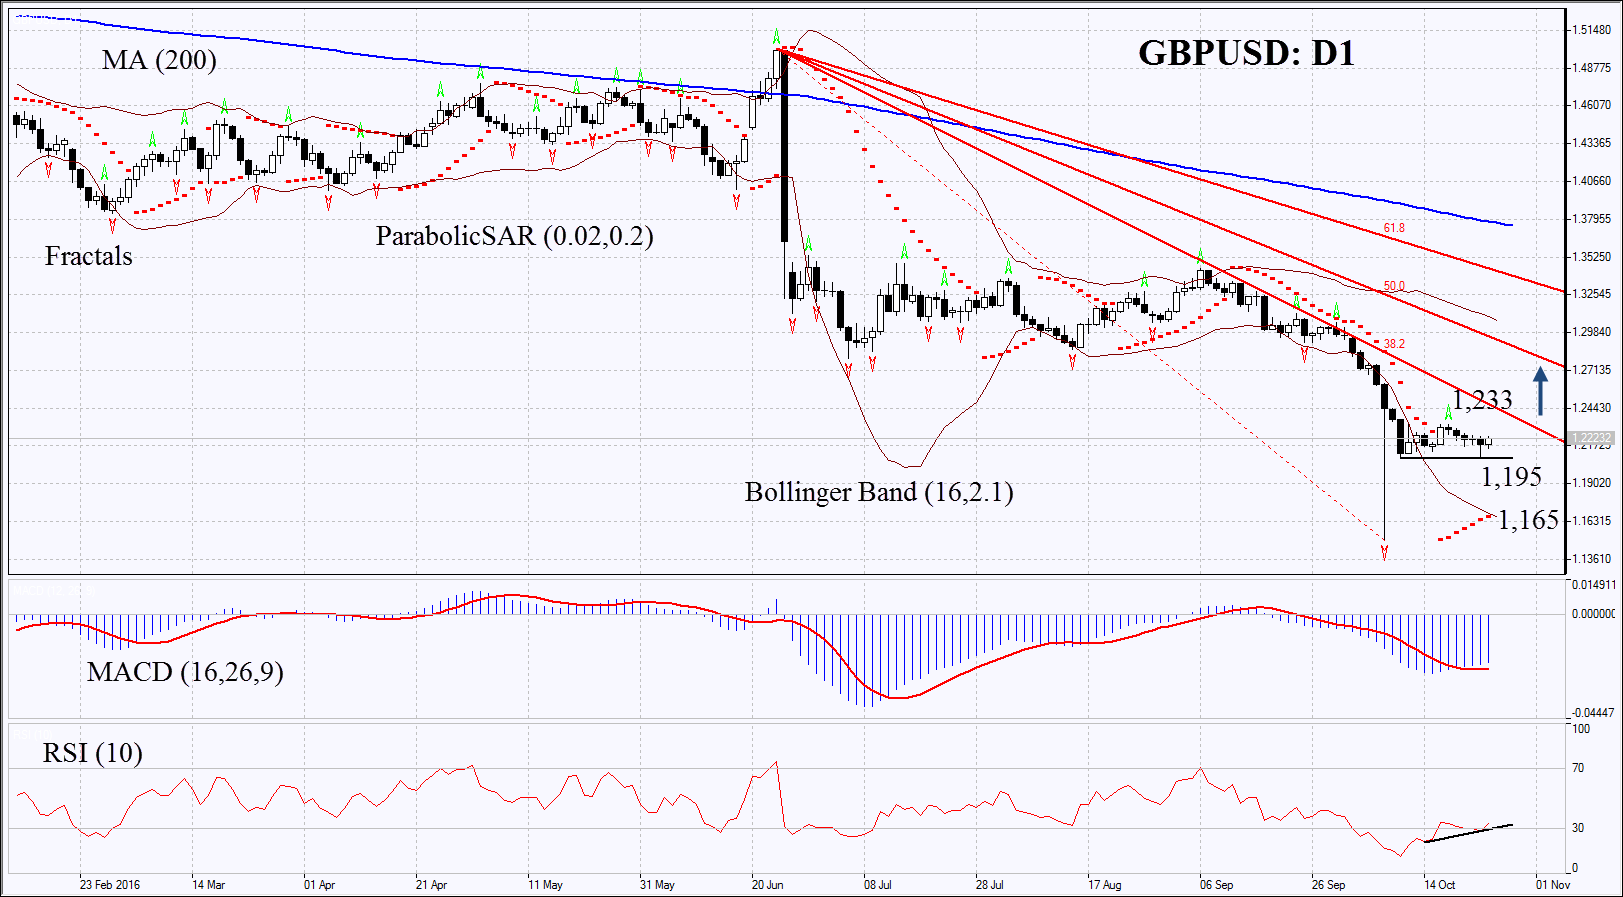
On the daily chart GBPUSD: D1 is consolidated in a narrow range after its slump. Upward correction is probable in case British pound remains one of settlement currencies in common-European market, soft Brexit and steady growth of British economy.
- Parabolic is giving bullish signals. It may serve the additional level of support.
- Bollinger bands have widened which means higher volatility.
- RSI is below 50 close to the oversold zone. It has formed positive divergence.
- MACD is giving bullish signals.
The bullish momentum may develop in case the British pound surpasses the last fractal high at 1.233. This level may serve the point of entry. The initial stop-loss may be placed below the support of the sideways trend at 1.195. The most risk-averse traders may place stop-loss at the level of Parabolic signal or lower Bollinger band at 1.165. Having opened the pending order we shall move the stop to the next fractal low following the Parabolic and Bollinger signals. Thus, we are changing the probable profit/loss ratio to the breakeven point. The most risk-averse traders may switch to the 4-hour chart after the trade and place there a stop-loss moving it in the direction of the trade. If the price meets the stop-loss level at 1.195 or 1.165 without reaching the order at 1.233, we recommend cancelling the position: the market sustains internal changes which were not taken into account.
Summary of technical analysis
| Position | Buy |
| Buy stop | above 1.233 |
| Stop loss | below 1.195 or 1.165 |
- Get Certificate

Perhatian:
Tinjauan ini memiliki karakter informatif dan tutorial dan dipublikasikan secara gratis. Semua data, termasuk dalam Tinjauan, diterima dari sumber publik, diakui kurang lebih dapat diandalkan. Apalagi, tidak ada jaminan bahwa informasi yang ditunjukkan penuh dan tepat. tinjauan tidak diperbarui. Keseluruhan informasi dalam setiap tinjauan, termasuk pendapat, indikator, grafik dan hal lainnya, disediakan hanya untuk tujuan pengenalan dan bukan saran keuangan atau rekomendasi. Seluruh teks dan bagiannya, serta grafik tidak dapat dianggap sebagai tawaran untuk membuat kesepakatan dengan aset apa pun. Pasar IFC dan karyawannya dalam kondisi apapun tidak bertanggung jawab atas tindakan yang dilakukan oleh orang lain selama atau setelah membaca tinjauan.
