- Analisis
- Analisis teknis
USD/CHF Analisis teknis - USD/CHF Jual beli: 2015-03-19
Restoring USD/CHF position after retracement
Yesterday the Fed Chair Janet Yellen spoke at the Fed meeting where concerns were expressed over the US economy performance that appears to be worsening. Market participants decided that it implies a possible delay in the rate hike. Previously, they were confident that it would happen in July. Besides, the Fed dropped a hint that even if the rate would be increased, it wouldn’t be raised more than 0.6% by the end of this year. Meanwhile, the majority of investors hoped it to be hiked up to 1.1%. The discordance between the Fed official data and market expectations caused the most abrupt daily US dollar collapse in 18 months. Currently we can observe the opposite movement indicating the currency strengthening, but we regard it as retracement so far. Significant US macroeconomic data is not released today. In theory, in case of counting on the continued US dollar weakening you may open a position on any currency pair. However, we suggest looking at the Swiss franc chart. This morning the Swiss National Bank announced that interest rates were left unchanged, but the bank remarked being ready for foreign exchange intervention if the national currency soars. In turn, we recommend using a relatively close Stop loss level as there is a risk of intervention.
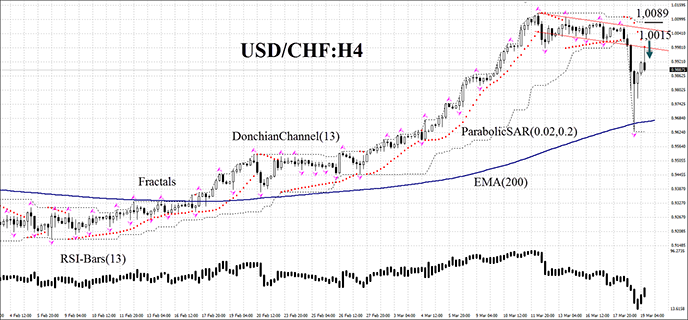
USD/CHF technical analysis: the price showed a strong uptrend for quite a long time on the H4 chart. Now there is a pullback and it tumbled down to its moving average (200) which was followed by a powerful rebound. Donchian Channel has widened greatly, which confirms the increased volatility. RSI oscillator plunged into the oversold zone, but quickly got out of it, although still remaining below 50. We do not rule out the bearish momentum being developed after the rebound is being finished and maintaining the resistance level at the last Parabolic points at 1.0015. Stop loss is to be placed at the level of the Donchian Channel upper boundary, which can currently act as the second resistance line at 1.0089. After pending order placing, Stop loss is to be moved every four hours near the next fractal high, following Parabolic and Donchian Channel signals. Thus, we are changing the probable profit/loss ratio to the breakeven point. If the price meets stop loss level without reaching the order, we recommend cancelling the position: market sustains internal changes which were not considered.
| Position | Sell |
| Sell limit | below 1.0015 |
| Stop loss | above 1.0089 |
Dear traders. For the detailed report of the strategy based on analytical issues of technical analysis click here.
- Get Certificate

Perhatian:
Tinjauan ini memiliki karakter informatif dan tutorial dan dipublikasikan secara gratis. Semua data, termasuk dalam Tinjauan, diterima dari sumber publik, diakui kurang lebih dapat diandalkan. Apalagi, tidak ada jaminan bahwa informasi yang ditunjukkan penuh dan tepat. tinjauan tidak diperbarui. Keseluruhan informasi dalam setiap tinjauan, termasuk pendapat, indikator, grafik dan hal lainnya, disediakan hanya untuk tujuan pengenalan dan bukan saran keuangan atau rekomendasi. Seluruh teks dan bagiannya, serta grafik tidak dapat dianggap sebagai tawaran untuk membuat kesepakatan dengan aset apa pun. Pasar IFC dan karyawannya dalam kondisi apapun tidak bertanggung jawab atas tindakan yang dilakukan oleh orang lain selama atau setelah membaca tinjauan.
