- Analisis
- Analisis teknis
USD/CHF Analisis teknis - USD/CHF Jual beli: 2016-04-18
Can’t strengthen on weak US data
The Swiss franc did not strengthen against the US currency on Friday. The weak economic data came out in US on Friday which pushed the US Dollar index down. Investors assume the Swiss National Bank (SNB) may cut the rates further which stops the currency from strengthening. Will the Swiss franc edge lower? On chart it will look as its increase.
The US industrial production data came out on Friday for March as well as the consumer confidence index by Michigan University. They were below the initial projections which slightly lowered the chances for the Fed rate hike and pushed the US dollar index down. Meanwhile, the Swiss franc did not strengthen a lot. The current SNB rate is -0.25%. The target inflation is 2% while is March the real reading was -0.9% year on year. The negative or neutral inflation is observed in Switzerland since September 2014 which substantially raises the deflation risks. According to consensus forecasts, market participants expect the further SNB rate cuts to -0.75% till the end of the year. This may happen as early as on the next SNB meeting on June 16, 2016. This year three meetings are scheduled. The Swiss inflation data for April to be published on May 9 may influence the rate decision. The next significant data will be released on April 20 and 21: the ZEW survey expectations and the Swiss trade balance, import and export data for March.
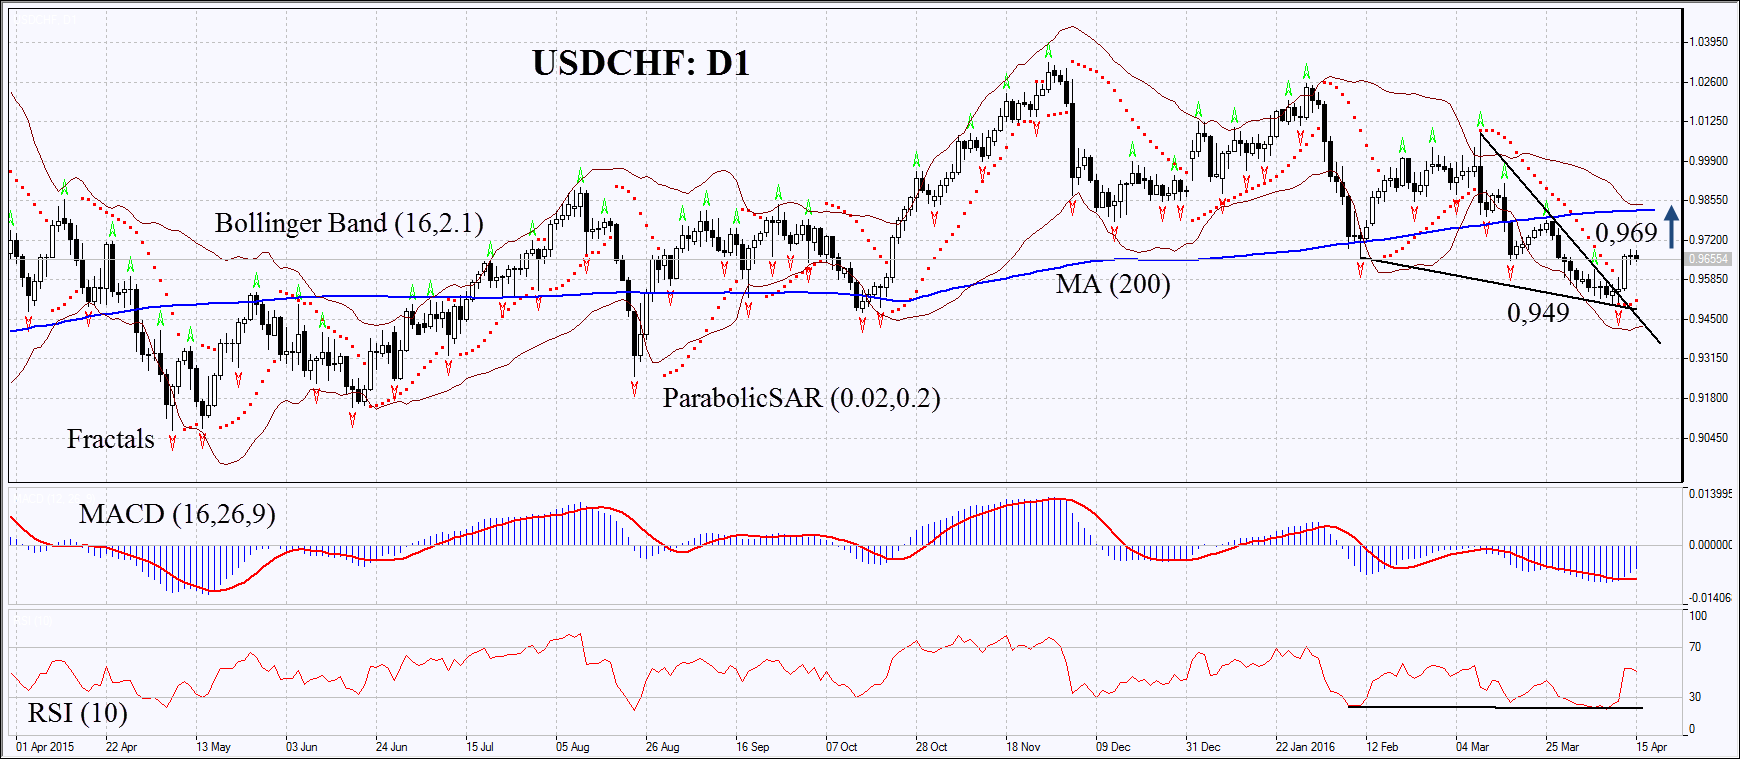
On the daily chart USDCHF: D1 has surpassed the resistance of the downtrend. The MACD and Parabolic indicators have formed the bullish signals. The RSI is above 50 and has formed the positive divergence. The Bollinger bands are contracting which means lower volatility. The bullish momentum may develop in case the Swiss franc surpasses the next high of 0.969. This level may serve the point of entry. The initial risk-limit may be placed below the Parabolic signal and the last fractal low at 0.949. Having opened the pending order we shall move the stop to the next fractal low following the Parabolic and Bollinger signals. Thus, we are changing the probable profit/loss ratio to the breakeven point. The most risk-averse traders may switch to the 4-hour chart after the trade and place there a stop-loss moving it in the direction of the trade. If the price meets the stop-loss level at 0.949 without reaching the order at 0.969, we recommend cancelling the position: the market sustains internal changes which were not taken into account.
| Position | Buy |
| Buy stop | above 0.969 |
| Stop loss | below 0.949 |
Explore our
Trading Conditions
- Spreads from 0.0 pip
- 30,000+ Trading Instruments
- Stop Out Level - Only 10%
Ready to Trade?
Open Account Perhatian:
Tinjauan ini memiliki karakter informatif dan tutorial dan dipublikasikan secara gratis. Semua data, termasuk dalam Tinjauan, diterima dari sumber publik, diakui kurang lebih dapat diandalkan. Apalagi, tidak ada jaminan bahwa informasi yang ditunjukkan penuh dan tepat. tinjauan tidak diperbarui. Keseluruhan informasi dalam setiap tinjauan, termasuk pendapat, indikator, grafik dan hal lainnya, disediakan hanya untuk tujuan pengenalan dan bukan saran keuangan atau rekomendasi. Seluruh teks dan bagiannya, serta grafik tidak dapat dianggap sebagai tawaran untuk membuat kesepakatan dengan aset apa pun. Pasar IFC dan karyawannya dalam kondisi apapun tidak bertanggung jawab atas tindakan yang dilakukan oleh orang lain selama atau setelah membaca tinjauan.
