- Analisis
- Analisis teknis
USD/CHF Analisis teknis - USD/CHF Jual beli: 2016-05-11
Negative rates may make Swiss franc less appealing
Swiss banking giant UBS is planning to pass on negative interest rates or raise commission for wealthy corporate clients. Its CEO Sergio Ermotti sees it as a necessary step after the Swiss National Bank set negative interest rates in early 2015. This news from UBS pushed the Swiss franc lower. Will the trend continue? On USDCHF chart it looks as growth.
UBS has released weak earnings for Q1 2016. Its net income fell 64%. Compared to the start of the year, its stocks are being traded 20% lower. Market participants assume the Swiss banks may adopt negative interest rates following steps of Swiss National Bank (SNB). In theory, this will make the local currency less appealing. The next significant economic data will be released in Switzerland on May 24: trade balance for this April. In March its surplus was the lowest since December 2014. We believe the main factor for Swiss franc weakening is the risk of further interest rate cut by SNB from current -0.25% to -0.75% till the end of the year. The first such a cut may happen on next SNB meeting on June 16. The Bank will be guided by Swiss GDP for Q1 2016 and inflation for May to be released on May 1 and 8, respectively.
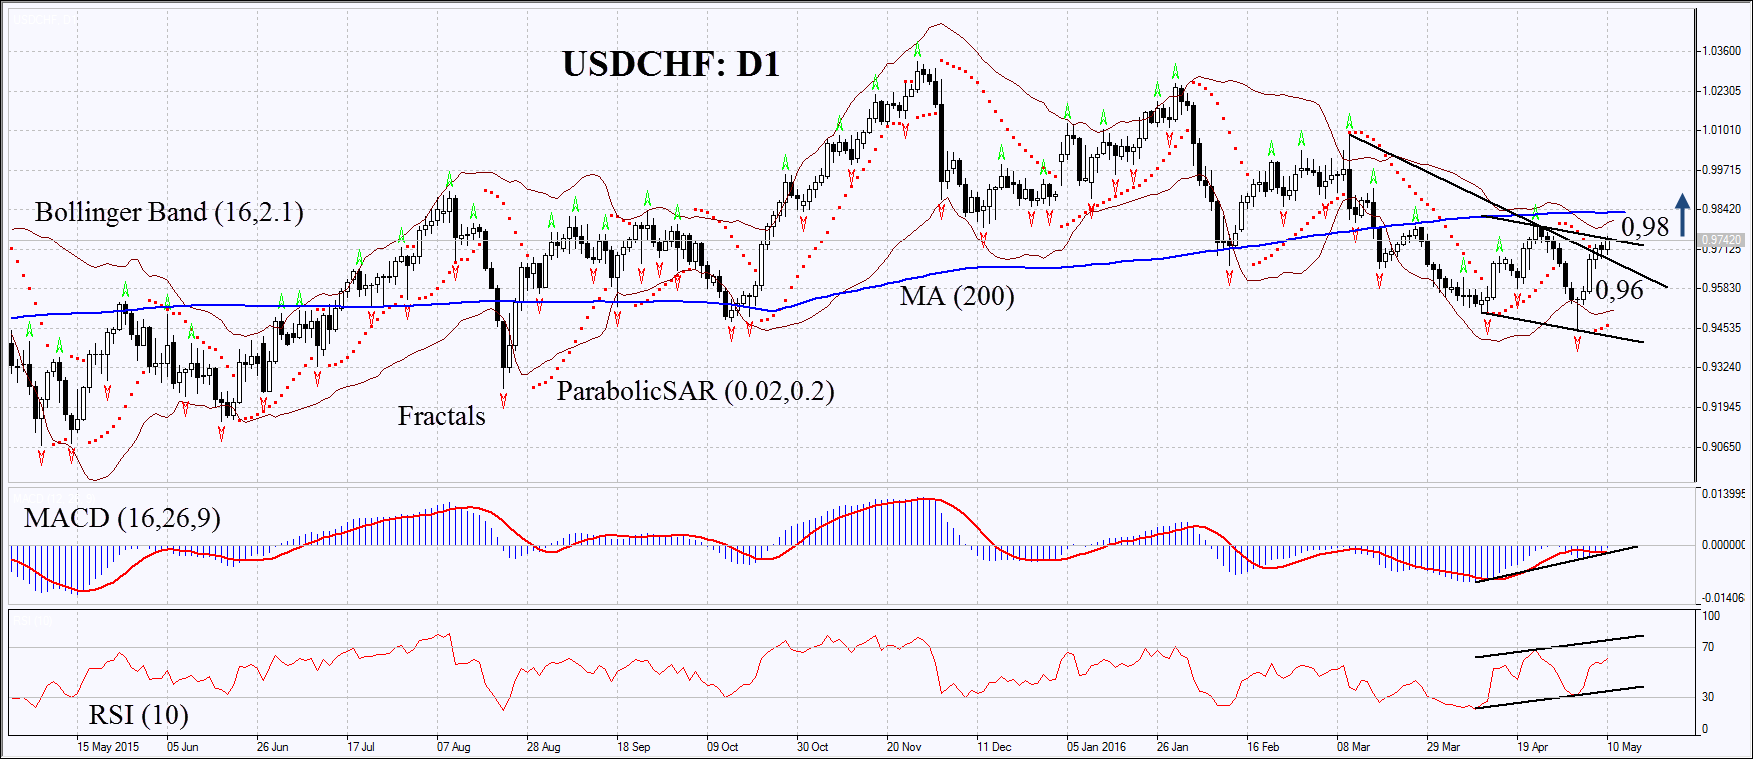
On the daily chart USDCHF: D1 has approached the upper boundary of the descending channel. The MACD and Parabolic indicators give signals to buy. RSI has formed the positive divergence but has not yet reached the overbought zone. The Bollinger bands have contracted which means lower volatility. They are tilted upwards. The bullish momentum may develop in case the Swiss franc surpasses the last fractal high and the Bollinger band at 0.98. This level may serve the point of entry. The initial risk-limit may be placed below the already crossed line of the downtrend at 0 96. Having opened the pending order we shall move the stop to the next fractal low following the Parabolic and Bollinger signals. Thus, we are changing the probable profit/loss ratio to the breakeven point. The most risk-averse traders may switch to the 4-hour chart after the trade and place there a stop-loss moving it in the direction of the trade. If the price meets the stop-loss level at 0.96 without reaching the order at 0.98, we recommend cancelling the position: the market sustains internal changes which were not taken into account.
| Position | Buy |
| Buy stop | above 0.98 |
| Stop loss | below 0.96 |
- Get Certificate

Perhatian:
Tinjauan ini memiliki karakter informatif dan tutorial dan dipublikasikan secara gratis. Semua data, termasuk dalam Tinjauan, diterima dari sumber publik, diakui kurang lebih dapat diandalkan. Apalagi, tidak ada jaminan bahwa informasi yang ditunjukkan penuh dan tepat. tinjauan tidak diperbarui. Keseluruhan informasi dalam setiap tinjauan, termasuk pendapat, indikator, grafik dan hal lainnya, disediakan hanya untuk tujuan pengenalan dan bukan saran keuangan atau rekomendasi. Seluruh teks dan bagiannya, serta grafik tidak dapat dianggap sebagai tawaran untuk membuat kesepakatan dengan aset apa pun. Pasar IFC dan karyawannya dalam kondisi apapun tidak bertanggung jawab atas tindakan yang dilakukan oleh orang lain selama atau setelah membaca tinjauan.
