- Analisis
- Analisis teknis
Gold Analisis teknis - Gold Jual beli: 2017-02-17
Uncertainty about the EU future supports gold prices
Sustained inflation above Fed’s target threshold 2% and low unemployment increase the likelihood of a rate hike sooner rather than later this year. This will strengthen the US dollar and pressure gold. Will gold prices continue rising?
Gold prices are rising after hitting almost two year lows in mid-December. The increased political uncertainty about the future of euro-zone ahead of French presidential elections is the main bullish factor supporting gold prices in short term perspective. The National Front leader Marine Le Pen has vowed to hold a referendum on European Union membership in six months time if she is voted in. A major bearish factor for gold is the anticipation of Fed’s monetary policy tightening. At its testimony before US Senate and Congress committees this week Fed chair Janet Yellen confirmed the central bank plans three rate hikes this year and will raise rates at coming policy meetings as it would be ’unwise to wait too long to tighten’ mentioning signs of inflation and wage growth. This left the door open for a March rate hike though investors deem the likelihood of a March hike not high as Fed officials have said they’d like to see the recent uptick in inflation be sustained before they raise interest rates. On Wednesday data showed the Consumer Price Index rose 0.6% in the month, the largest amount in four years, with headline inflation above Fed’s target of 2%.
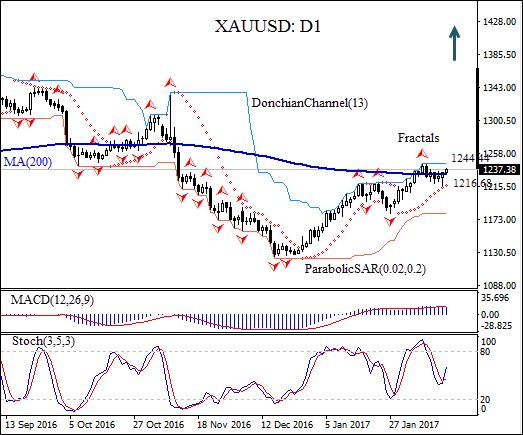
The XAUUSD: D1 has breached above the 200-day moving average MA(200) on the daily chart.
- Parabolic indicator gives a buy signal.
- The Donchian channel indicates no uptrend yet: it is flat.
- The MACD indicator is neutral.
- The stochastic oscillator is rising and hasn’t reached the overbought zone yet.
We believe the bullish momentum will continue after the price closes above the MA(200) and the upper Donchian boundary at $1244.44, confirmed also by fractal high. A pending order to buy can be placed above that level. The stop loss can be placed below the Parabolic signal at $1216.68. After placing the order, the stop loss is to be moved every day to the next fractal low, following Parabolic signals. Thus, we are changing the probable profit/loss ratio to the breakeven point. The most risk-averse traders may switch to the 4-hour chart after the trade and place there a stop-loss moving it in the direction of the trade. If the price meets the stop loss level ($1216.68) without reaching the order ($1244.44), we recommend canceling the position: the market sustains internal changes which were not taken into account.
Technical Analysis Summary
| Position | Buy |
| Buy stop | Above 1244.44 |
| Stop loss | Below 1216.68 |
- Get Certificate

Perhatian:
Tinjauan ini memiliki karakter informatif dan tutorial dan dipublikasikan secara gratis. Semua data, termasuk dalam Tinjauan, diterima dari sumber publik, diakui kurang lebih dapat diandalkan. Apalagi, tidak ada jaminan bahwa informasi yang ditunjukkan penuh dan tepat. tinjauan tidak diperbarui. Keseluruhan informasi dalam setiap tinjauan, termasuk pendapat, indikator, grafik dan hal lainnya, disediakan hanya untuk tujuan pengenalan dan bukan saran keuangan atau rekomendasi. Seluruh teks dan bagiannya, serta grafik tidak dapat dianggap sebagai tawaran untuk membuat kesepakatan dengan aset apa pun. Pasar IFC dan karyawannya dalam kondisi apapun tidak bertanggung jawab atas tindakan yang dilakukan oleh orang lain selama atau setelah membaca tinjauan.
