- Analisis
- Analisis teknis
Palladium Analisis teknis - Palladium Jual beli: 2016-08-24
Palladium reserves decline in ETF funds
Palladium reserves in the world’s biggest ETF fell 12% since the start of the year and 3% since August. If the Fed Chair Janet Yellen says on Friday at the meeting of central bankers that interest rate hike is looming, this may negatively affect the precious metals. Will palladium prices fall?
Its export from Switzerland almost doubled in July to 1333 kg from 624 kg in June. This country is the world’s principal arena for trading precious metals. The demand for palladium depends on auto sales as the metal is used to produce catalysts for engines. We doubt the major producers will manage to maintain high pace of rising demand. The auto sales rose in Europe 7% in June and 9.4% in first half of 2016 compared to first half of 2015, according to European Automobile Manufacturers Association. They are on the rise already for 34 successive months. 1.46mln new cars were registered in June in 27 EU countries. The sales of automobiles in China rose in July by 23% to 1.6mln and are on the rise for 5 consecutive months, reports the China Association of Automobile Manufacturers. The rise in auto sales outpaces by far the economic growth and personal income. For this reason palladium prices advanced 29% this year outrunning the platinum which advanced 26%.
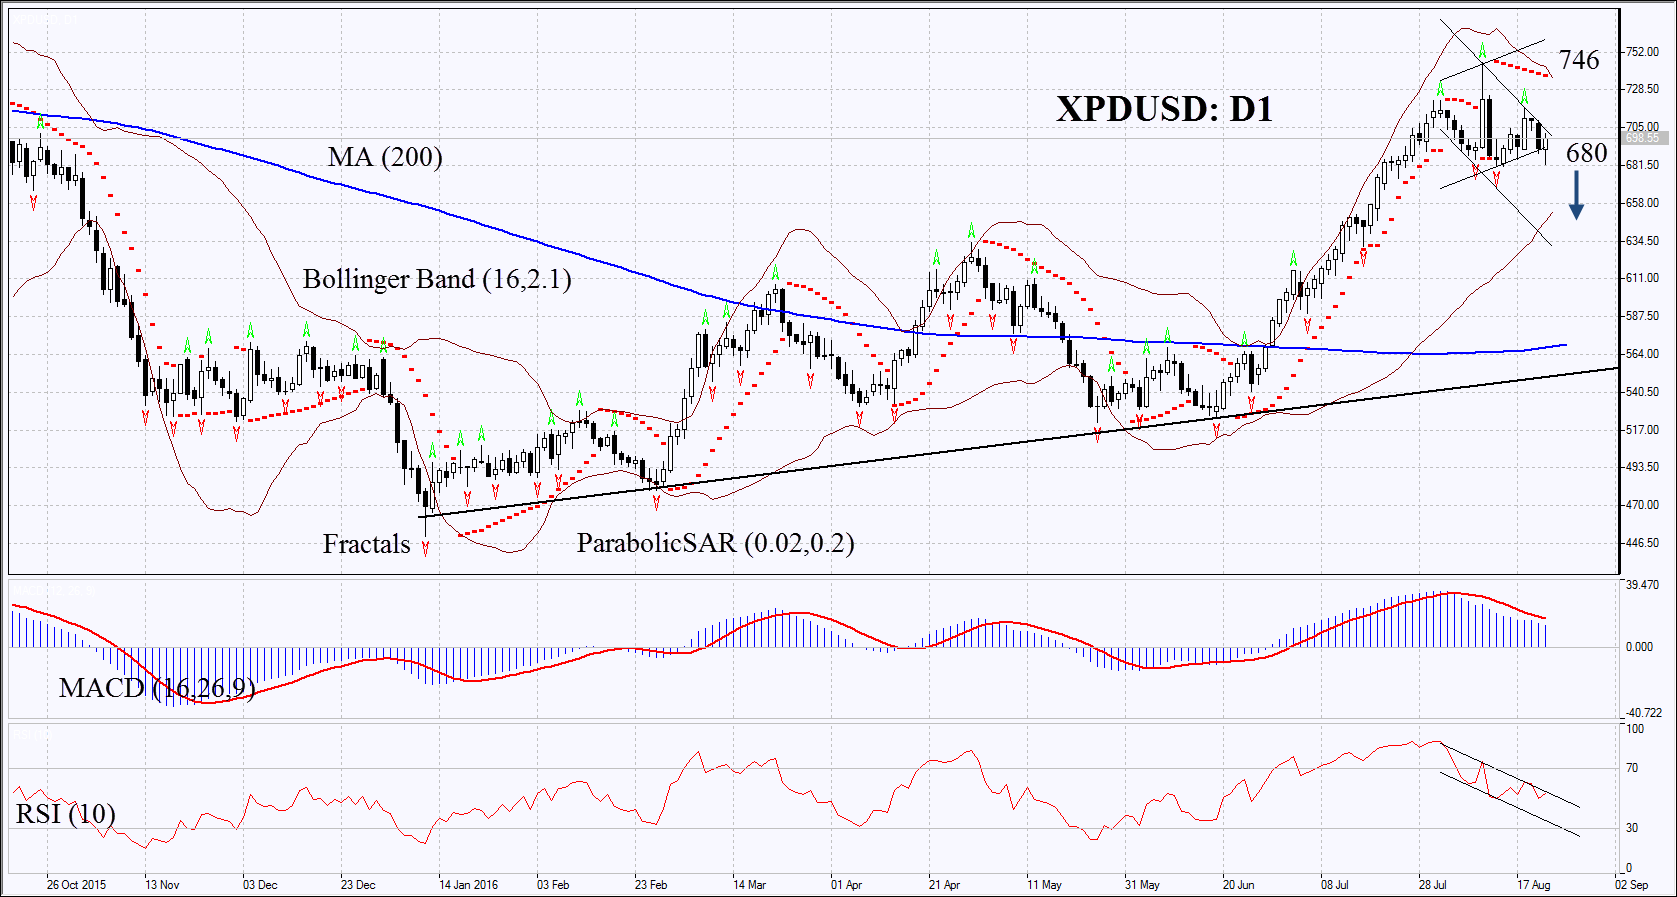
On the daily chart XPDUSD: D1 hit a fresh 14-month high two weeks ago and formed a diamond technical pattern. The MACD and Parabolic indicators have formed signals to sell. The Bollinger bands have widened which means higher volatility. RSI is near 50 and has formed negative divergence. The bearish momentum may develop in case the palladium prices fall below the two last fractal lows at 680. This level may serve the point of entry. The initial stop-loss may be placed above the 14-month high, the two last fractal highs, the Bollinger band and the Parabolic signal at 746. Having opened the pending order we shall move the stop to the next fractal high following the Parabolic and Bollinger signals. Thus, we are changing the probable profit/loss ratio to the breakeven point. The most risk-averse traders may switch to the 4-hour chart after the trade and place there a stop-loss moving it in the direction of the trade. If the price meets the stop-loss level at 746 without reaching the order at 680, we recommend cancelling the position: the market sustains internal changes which were not taken into account.
| Position | Sell |
| Sell stop | below 680 |
| Stop loss | above 746 |
- Get Certificate

Perhatian:
Tinjauan ini memiliki karakter informatif dan tutorial dan dipublikasikan secara gratis. Semua data, termasuk dalam Tinjauan, diterima dari sumber publik, diakui kurang lebih dapat diandalkan. Apalagi, tidak ada jaminan bahwa informasi yang ditunjukkan penuh dan tepat. tinjauan tidak diperbarui. Keseluruhan informasi dalam setiap tinjauan, termasuk pendapat, indikator, grafik dan hal lainnya, disediakan hanya untuk tujuan pengenalan dan bukan saran keuangan atau rekomendasi. Seluruh teks dan bagiannya, serta grafik tidak dapat dianggap sebagai tawaran untuk membuat kesepakatan dengan aset apa pun. Pasar IFC dan karyawannya dalam kondisi apapun tidak bertanggung jawab atas tindakan yang dilakukan oleh orang lain selama atau setelah membaca tinjauan.
