- Analisis
- Analisis teknis
Platinum Analisis teknis - Platinum Jual beli: 2017-02-21
Fed rate hike has negative effect on precious metals prices
Possible Fed rate hike weighs down on precious metals prices. The additional negative for platinum is slight slowdown in manufacturing production in the US, EU and China. Will platinum prices edge lower?
This week several regional Fed chairs will speak. Moreover, the February Fed meeting minutes will be released on Wednesday. The US inflation data came out last week. It reached 2.5% in February year over year which is its record high in 5 years. The inflation surpassed the Fed target level of 2%. Theoretically, this may trigger the US Fed monetary tightening. Fed rate hike has negative effect on precious metals prices as investors consider them as alternative to dollar assets. Platinum is actively used in industry to produce catalysts. Lower industrial production may be the additional negative for its prices. European manufacturing production fell in December 2016 from 3.2% to 2% year over year. The Caixin and NBS manufacturing PMIs for January fell in China. Manufacturing production fell in US in January but ISM PMI advanced.
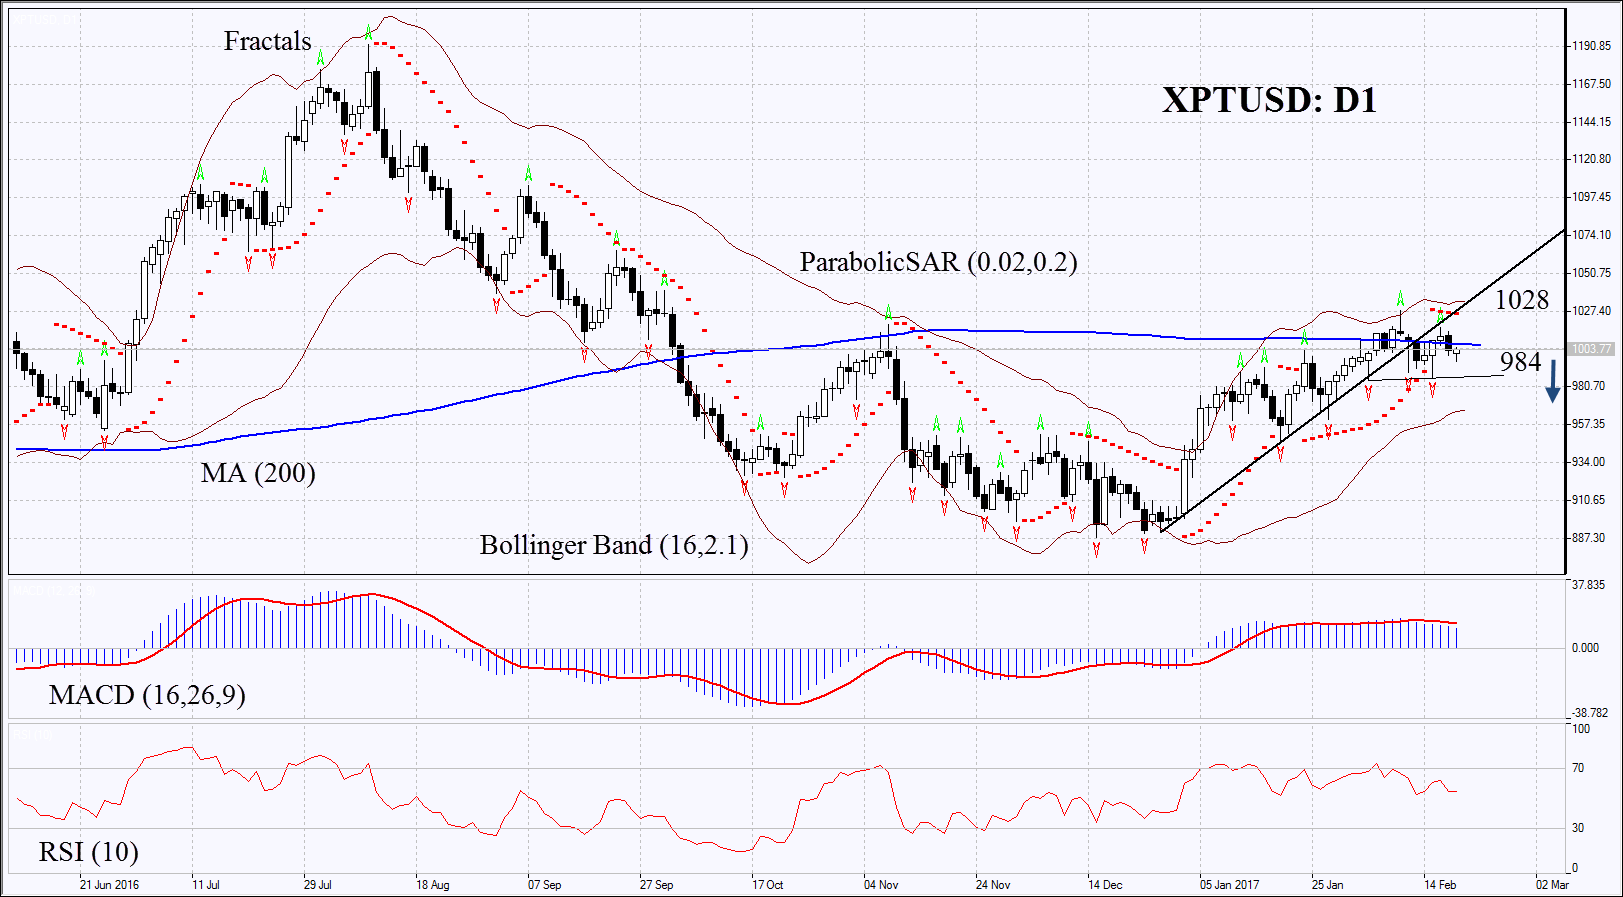
On the daily chart XPTUSD: D1 has left the rising trend to move sideways. Further decline in prices may happen in case of higher chances for the Fed rate hike, rising US dollar index and in case of slowdown in global industrial production growth.
- The Parabolic indicator is giving bearish signals.
- The Bollinger bands have narrowed which means lower volatility.
- The RSI is above 50, no divergence.
- The MACD is giving bearish signals.
The bearish momentum may develop in case XPTUSD falls below the three last fractal lows and the lower boundary of the neutral channel at 984. This level may serve the point of entry. The initial stop-loss may be placed above the 200-day moving average, the two last fractal highs, the Parabolic signal and the line of the previous rising trend at 1028. Having opened the pending order we shall move the stop to the next fractal high following the Parabolic and Bollinger signals. Thus, we are changing the probable profit/loss ratio to the breakeven point. The most risk-averse traders may switch to the 4-hour chart after the trade and place there a stop-loss moving it in the direction of the trade. If the price meets the stop-loss level at 1028 without reaching the order at 984, we recommend cancelling the position: the market sustains internal changes which were not taken into account.
Summary of technical analysis
| Position | Sell |
| Sell stop | below 984 |
| Stop loss | above 1028 |
- Get Certificate

Perhatian:
Tinjauan ini memiliki karakter informatif dan tutorial dan dipublikasikan secara gratis. Semua data, termasuk dalam Tinjauan, diterima dari sumber publik, diakui kurang lebih dapat diandalkan. Apalagi, tidak ada jaminan bahwa informasi yang ditunjukkan penuh dan tepat. tinjauan tidak diperbarui. Keseluruhan informasi dalam setiap tinjauan, termasuk pendapat, indikator, grafik dan hal lainnya, disediakan hanya untuk tujuan pengenalan dan bukan saran keuangan atau rekomendasi. Seluruh teks dan bagiannya, serta grafik tidak dapat dianggap sebagai tawaran untuk membuat kesepakatan dengan aset apa pun. Pasar IFC dan karyawannya dalam kondisi apapun tidak bertanggung jawab atas tindakan yang dilakukan oleh orang lain selama atau setelah membaca tinjauan.
