- Analisis
- Analisis teknis
TENCENT Analisis teknis - TENCENT Jual beli: 2019-05-24
Slowing sales forecast bearish for Tencent price
Tencent stock declined after the company forecast slowdown in sales in 2019. Will the Tencent price continue declining?
Hong Kong based media and entertainment group Tencent Holdings forecast sharp slowdown in video advertising sales in China in 2019. Its chief executive officer of video streaming business told Tuesday the growth rate of advertising sales on China's video platforms would decrease from 37% previously to 19%. Online advertising contributed 13.4 billion yuan ($1.94 billion), or nearly 16% of Tencent's total revenue in the first quarter of 2019. Gaming, news and video were the largest contributor to sales, accounting for 33% of revenue in the three months to March. Total revenue in the first quarter rose 16% - about a third of its pace in the same period a year earlier and the slowest revenue growth in the first quarter in 15 years. Lower revenue forecast is bearish for Tencent stock price.
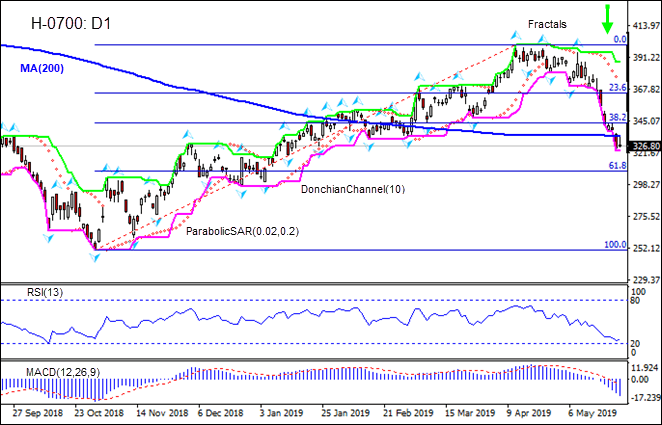
On the daily timeframe the H-0700: D1 has closed below the 200-day moving average MA(200) which is falling. This is bearish.
- The Parabolic indicator gives a sell signal.
- The Donchian channel indicates downtrend: it is tilted lower.
- The MACD indicator gives a bearish signal: it is below the signal line and the gap is widening.
- The RSI oscillator is rising after failing to breach into the oversold zone.
We believe the bearish momentum will continue after the price breaches below the lower boundary of Donchian channel at 323.15. This level can be used as an entry point for placing a pending order to sell. The stop loss can be placed above the Parabolic signal at 370.48. After placing the order, the stop loss is to be moved every day to the next fractal high, following Parabolic signals. Thus, we are changing the expected profit/loss ratio to the breakeven point. If the price meets the stop loss level (370.48) without reaching the order (323.15), we recommend cancelling the order: the market has undergone internal changes which were not taken into account.
Technical Analysis Summary
| Position | Sell |
| Sell stop | Below 323.15 |
| Stop loss | Above 370.48 |
- Get Certificate

Perhatian:
Tinjauan ini memiliki karakter informatif dan tutorial dan dipublikasikan secara gratis. Semua data, termasuk dalam Tinjauan, diterima dari sumber publik, diakui kurang lebih dapat diandalkan. Apalagi, tidak ada jaminan bahwa informasi yang ditunjukkan penuh dan tepat. tinjauan tidak diperbarui. Keseluruhan informasi dalam setiap tinjauan, termasuk pendapat, indikator, grafik dan hal lainnya, disediakan hanya untuk tujuan pengenalan dan bukan saran keuangan atau rekomendasi. Seluruh teks dan bagiannya, serta grafik tidak dapat dianggap sebagai tawaran untuk membuat kesepakatan dengan aset apa pun. Pasar IFC dan karyawannya dalam kondisi apapun tidak bertanggung jawab atas tindakan yang dilakukan oleh orang lain selama atau setelah membaca tinjauan.
