- Analisis
- Analisis teknis
Advanced Micro Devices Inc. Analisis teknis - Advanced Micro Devices Inc. Jual beli: 2019-07-18
Getting ready for AMD earnings report
AMD stock has breached below support. Will the AMD price continue declining?
The Advanced Micro Devices is to report Q2 earnings on July 24. In May the U.S. Department of Energy announced that AMD and Cray (NASDAQ:CRAY) had been awarded a $600 million contract to develop the ‘Frontier’ supercomputer to be used for calculations in areas like nuclear and climate research. In Q3 AMD plans to start selling its 7-nanometer (nm) chips. With these smaller and more power-efficient chips, AMD is aiming to take market share from Intel, especially in data center business. Intel’s 10nm chips which will not be sold until the end of the year. AMD expects its Q2 gross margin to be 41%, the highest in eight years on revenue about $1.52 billion, a decrease of approximately 13% YoY. Positive news have been priced in however: AMD price has risen over 90% year to date, and high volatility is likely before the earnings report, and any underperformance may result in steep declines.
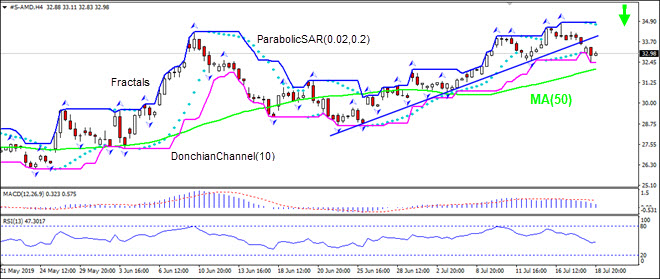
On the 4-hour timeframe the S-AMD: H4 has breached below the support line, this is bearish.
- The Parabolic indicator has formed a sell signal.
- The Donchian channel indicates no trend: it is flat.
- The MACD indicator gives a bearish signal: it is above the signal line and the gap is narrowing.
- The RSI oscillator is falling but has not reached the oversold zone.
We believe the bearish momentum will continue after the price breaches below the lower Donchian boundary at 32.42. This level can be used as an entry point for placing a pending order to sell. The stop loss can be placed above the fractal high at 34.85. After placing the order, the stop loss is to be moved every day to the next fractal high, following Parabolic signals. Thus, we are changing the expected profit/loss ratio to the breakeven point. If the price meets the stop loss level (34.85) without reaching the order (32.42), we recommend cancelling the order: the market has undergone internal changes which were not taken into account.
Technical Analysis Summary
| Position | Sell |
| Sell stop | Below 32.42 |
| Stop loss | Above 34.85 |
- Get Certificate

Perhatian:
Tinjauan ini memiliki karakter informatif dan tutorial dan dipublikasikan secara gratis. Semua data, termasuk dalam Tinjauan, diterima dari sumber publik, diakui kurang lebih dapat diandalkan. Apalagi, tidak ada jaminan bahwa informasi yang ditunjukkan penuh dan tepat. tinjauan tidak diperbarui. Keseluruhan informasi dalam setiap tinjauan, termasuk pendapat, indikator, grafik dan hal lainnya, disediakan hanya untuk tujuan pengenalan dan bukan saran keuangan atau rekomendasi. Seluruh teks dan bagiannya, serta grafik tidak dapat dianggap sebagai tawaran untuk membuat kesepakatan dengan aset apa pun. Pasar IFC dan karyawannya dalam kondisi apapun tidak bertanggung jawab atas tindakan yang dilakukan oleh orang lain selama atau setelah membaca tinjauan.
