- Analisis
- Analisis teknis
ASX 200 Analisis teknis - ASX 200 Jual beli: 2019-01-18
Rising retail sales bullish for Australian stock index
Retail sales rose in Australia in November. Will the AU200 stock index continue rebounding?
Latest data from Australia were positive on balance: retail sales rose in November and home loans contracted less than expected. Retail sales rose 0.4% on month to 5-month high when a steady growth at 0.3% was expected. And home loans slipped 0.9% on month when a 1.5% contraction was forecast. On the other hand consumer confidence deteriorated: consumer sentiment index fell from 104.4 in December to 99.6 in January. Rising consumer spending is bullish for Australia’s stock market index.
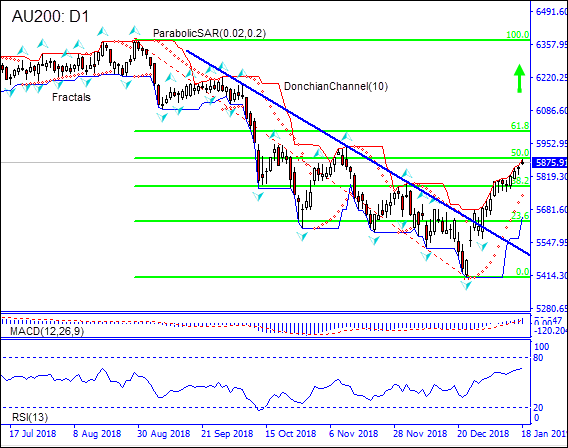
On the daily timeframe AU200: D1 is rallying after hitting twenty-five-month low in the end of December. The price is above the resistance line and the 38.2 Fibonacci level.
- The Donchian channel indicates an uptrend: it is tilted upward.
- The Parabolic indicator has formed a buy signal.
- The MACD indicator is above the signal line and the gap is widening, which is a bullish signal.
- The RSI oscillator is rising but has not reached the overbought zone.
We believe the bullish momentum will continue after the price closes above the upper boundary of Donchian channel at 5888.56. This level can be used as an entry point for placing a pending order to buy. The stop loss can be placed below the lower Donchian boundary at 5653.16. After placing the order, the stop loss is to be moved every day to the next fractal low, following Parabolic signals. Thus, we are changing the expected profit/loss ratio to the breakeven point. If the price meets the stop loss level (5653.16) without reaching the order (5888.56), we recommend cancelling the order: the market has undergone internal changes which were not taken into account.
Technical Analysis Summary
| Position | Buy |
| Buy stop | Above 5888.56 |
| Stop loss | Below 5653.16 |
- Get Certificate

Perhatian:
Tinjauan ini memiliki karakter informatif dan tutorial dan dipublikasikan secara gratis. Semua data, termasuk dalam Tinjauan, diterima dari sumber publik, diakui kurang lebih dapat diandalkan. Apalagi, tidak ada jaminan bahwa informasi yang ditunjukkan penuh dan tepat. tinjauan tidak diperbarui. Keseluruhan informasi dalam setiap tinjauan, termasuk pendapat, indikator, grafik dan hal lainnya, disediakan hanya untuk tujuan pengenalan dan bukan saran keuangan atau rekomendasi. Seluruh teks dan bagiannya, serta grafik tidak dapat dianggap sebagai tawaran untuk membuat kesepakatan dengan aset apa pun. Pasar IFC dan karyawannya dalam kondisi apapun tidak bertanggung jawab atas tindakan yang dilakukan oleh orang lain selama atau setelah membaca tinjauan.
