- Analisis
- Analisis teknis
ASX 200 Analisis teknis - ASX 200 Jual beli: 2019-07-05
Improving trade surplus bullish for AU200
Trade surplus and retail sales rose in Australia. Will the AU200 stock index continue advancing?
Recent economic data from Australia were positive: Australia's retail sales rose in May and trade surplus hit record high. Retail sales rose by 0.1% in May after 0.1% decline in April, driven by stronger spending in restaurants and on household goods. Australia's trade surplus rose to a record A$5.745 billion in May following A$4.820 billion surplus in April, as exports rose by 4%, while imports rose by 1%. The increasing export was supported by rising prices for commodities as well as weaken currency as the Reserve Bank of Australia lowered interest rates. The Reserve Bank of Australia cut interest rates for the second time in as many months on Tuesday to 1.00%, down from 1.25%, adding to a cut in June. Rising trade surplus and consumer sentiment is bullish for Australia’s stock market index.
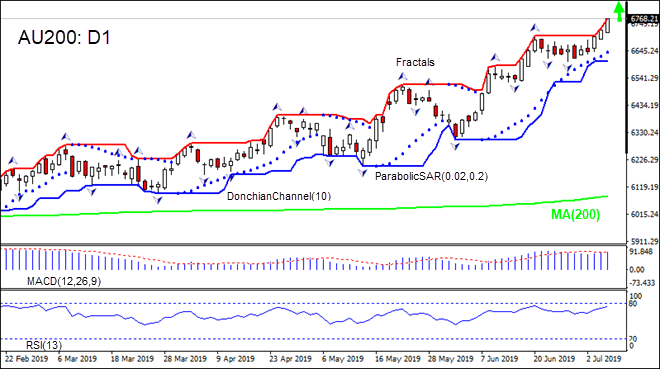
On the daily timeframe AU200: D1 is gaining after hitting seven-month low in the end of February.
- The Donchian channel indicates an uptrend: it is widening upward.
- The Parabolic indicator has formed a buy signal.
- The MACD indicator is above the signal line and the gap is widening, which is a bullish signal.
- The RSI oscillator is rising and is reaching the overbought zone.
We believe the bullish momentum will continue after the price closes above the upper boundary of Donchian channel at 6768.61. This level can be used as an entry point for placing a pending order to buy. The stop loss can be placed below the lower Donchian boundary at 6605.31. After placing the order, the stop loss is to be moved every day to the next fractal low, following Parabolic signals. Thus, we are changing the expected profit/loss ratio to the breakeven point. If the price meets the stop loss level (6605.31) without reaching the order (6768.61), we recommend cancelling the order: the market has undergone internal changes which were not taken into account.
Technical Analysis Summary
| Position | Buy |
| Buy stop | Above 6768.61 |
| Stop loss | Below 6605.31 |
- Get Certificate

Perhatian:
Tinjauan ini memiliki karakter informatif dan tutorial dan dipublikasikan secara gratis. Semua data, termasuk dalam Tinjauan, diterima dari sumber publik, diakui kurang lebih dapat diandalkan. Apalagi, tidak ada jaminan bahwa informasi yang ditunjukkan penuh dan tepat. tinjauan tidak diperbarui. Keseluruhan informasi dalam setiap tinjauan, termasuk pendapat, indikator, grafik dan hal lainnya, disediakan hanya untuk tujuan pengenalan dan bukan saran keuangan atau rekomendasi. Seluruh teks dan bagiannya, serta grafik tidak dapat dianggap sebagai tawaran untuk membuat kesepakatan dengan aset apa pun. Pasar IFC dan karyawannya dalam kondisi apapun tidak bertanggung jawab atas tindakan yang dilakukan oleh orang lain selama atau setelah membaca tinjauan.
