- Analisis
- Analisis teknis
AUD/USD Analisis teknis - AUD/USD Jual beli: 2017-05-26
Improving global growth lifts Australian dollar
The Reserve Bank of Australia held its policy unchanged at May policy meeting. The Australian dollar is rising after positive recent data. Will the Australian dollar continue strengthening?
The Reserve Bank of Australia (RBA) held the interest rate at 1.5% at its May 2 policy meeting. RBA governor Philip Lowe said inflation was starting to move in line with the RBA's expectations and a gradual increase in underlying inflation is expected as the economy strengthens. Inflation jumped from 1.5% in Q4 to 2.1% in Q1, above the 2.0%-3.0% target band of the RBA for the first time in almost three years. Governor Lowe noted that the improvement in the global economy has resulted in higher commodity prices, lifting Australia's GDP. Recent economic data were mixed: unemployment rate fell to 5.7% in April from 5.9% in March. And the business confidence index by the National Australia Bank (NAB) rose to 13 points in April, up from the 6 points registered in March and the highest reading in over seven years. At the same time retail sales in March contracted 0.1% on month, less than the 0.2% contraction in February. It is expected that with improving global growth continued recovery in business investment and household consumption will further boost Australia’s GDP, contributing to Australian dollar’s strength.
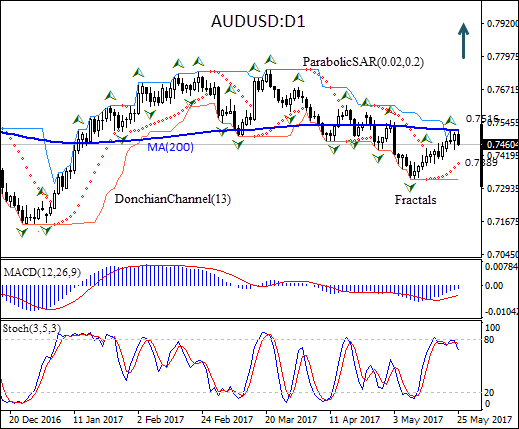
On the daily timeframe AUDUSD: D1 is rebounding after hitting five-month low in the beginning of May. The price has approached the 200-day moving average MA(200).
- The Donchian channel indicates no trend yet: it is flat.
- The Parabolic indicator has formed a buy signal.
- The MACD indicator is below the signal line and the gap is narrowing, which is a bullish signal.
- The stochastic oscillator has bounced off from the overbought zone threshold and is falling.
We believe the bullish momentum will continue after the price closes above the upper boundary of Donchian channel at 0.7516, confirmed also by fractal high. This level can be used as an entry point for placing a pending order to buy. The stop loss can be placed below the Parabolic signal at 0.7389. After placing the order, the stop loss is to be moved every day to the next fractal low, following Parabolic signals. Thus, we are changing the probable profit/loss ratio to the breakeven point. If the price meets the stop loss level (0.7389) without reaching the order (0.7516), we recommend cancelling the position: the market has undergone internal changes which were not taken into account.
Technical Analysis Summary
| Position | Buy |
| Buy stop | Above 0.7516 |
| Stop loss | Below 0.7389 |
- Get Certificate

Perhatian:
Tinjauan ini memiliki karakter informatif dan tutorial dan dipublikasikan secara gratis. Semua data, termasuk dalam Tinjauan, diterima dari sumber publik, diakui kurang lebih dapat diandalkan. Apalagi, tidak ada jaminan bahwa informasi yang ditunjukkan penuh dan tepat. tinjauan tidak diperbarui. Keseluruhan informasi dalam setiap tinjauan, termasuk pendapat, indikator, grafik dan hal lainnya, disediakan hanya untuk tujuan pengenalan dan bukan saran keuangan atau rekomendasi. Seluruh teks dan bagiannya, serta grafik tidak dapat dianggap sebagai tawaran untuk membuat kesepakatan dengan aset apa pun. Pasar IFC dan karyawannya dalam kondisi apapun tidak bertanggung jawab atas tindakan yang dilakukan oleh orang lain selama atau setelah membaca tinjauan.
