- Analisis
- Analisis teknis
Kapas Analisis teknis - Kapas Jual beli: 2018-06-18
Trade wars may contribute to the decrease of prices
China promised a symmetrical response to the increase in import duties in the US. Will cotton prices fall?
Earlier, Donald Trump reported that the US imposed a 25% duty on a number of Chinese goods supplied to the country at a cost of $50 billion a year. China, in return, will most likely raise duties on some US goods. The main export goods are soybean and cotton. Let us note that China continues to sell cotton from state reserves. At the last auction on Friday, 12.5 thousand tons were sold, which was approximately 40% of the declared volume. Another negative factor for prices may be the forecast of the Confederation of Indian Textile Industry. According to the Confederation of Indian Textile Industry, the cotton crop in India in the 2017-2018 season will increase by 8.1% compared to the previous season due to an increase in crop areas by 13%.
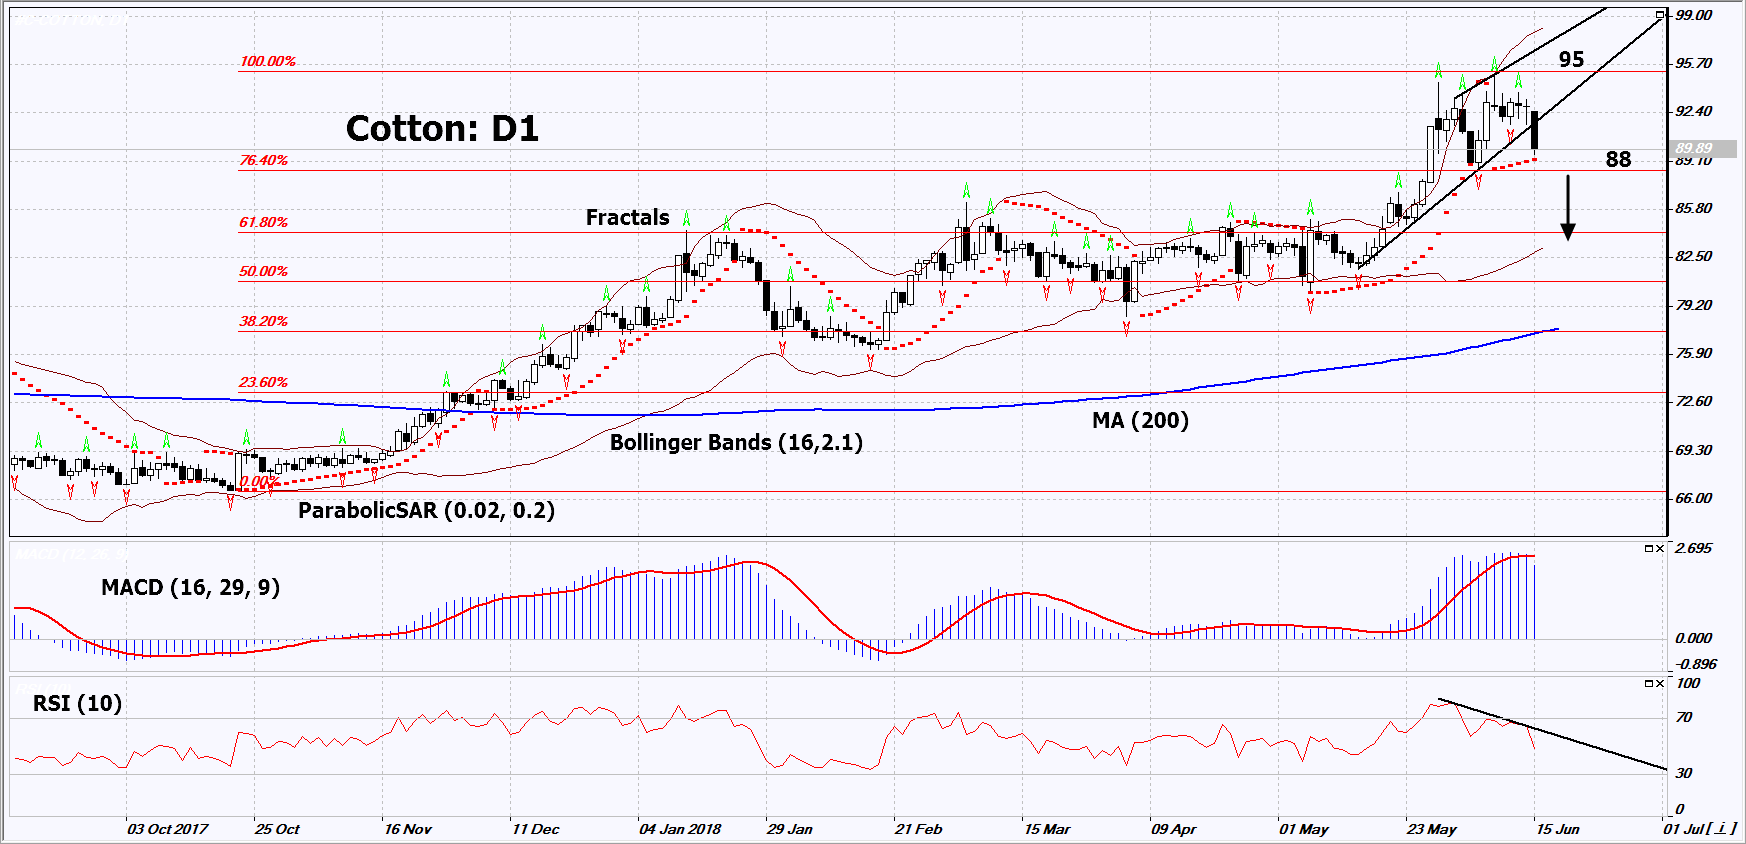
On the daily timeframe, Cotton: D1 breached down the support line of the accelerated uptrend. The medium-term uptrend endures, but the prices are corrected down from the maximum since March 2014. China's duties on the import of cotton from the United States can contribute to the further price decrease.
- The Parabolic indicator gives a bullish signal. It can be used as an additional support level, which needs to be breached before opening a sell position.
- The Bollinger bands have widened, which indicates high volatility.
- The RSI indicator is below 50. It has formed a negative divergence.
- The MACD indicator gives bearish signals.
The bearish momentum may develop in case Cotton falls below its last fractal low and the Parabolic signal at 88. This level may serve as an entry point. The initial stop loss may be placed above the two last fractal highs and the 4-year high at 95. After opening the pending order, we shall move the stop to the next fractal high following the Bollinger and Parabolic signals. Thus, we are changing the potential profit/loss to the breakeven point. More risk-averse traders may switch to the 4-hour chart after the trade and place there a stop loss moving it in the direction of the trade. If the price meets the stop level at 95 without reaching the order at 88, we recommend to close the position: the market sustains internal changes that were not taken into account.
Summary of technical analysis
| Position | Sell |
| Sell stop | Below 88 |
| Stop loss | Above 95 |
- Get Certificate

Perhatian:
Tinjauan ini memiliki karakter informatif dan tutorial dan dipublikasikan secara gratis. Semua data, termasuk dalam Tinjauan, diterima dari sumber publik, diakui kurang lebih dapat diandalkan. Apalagi, tidak ada jaminan bahwa informasi yang ditunjukkan penuh dan tepat. tinjauan tidak diperbarui. Keseluruhan informasi dalam setiap tinjauan, termasuk pendapat, indikator, grafik dan hal lainnya, disediakan hanya untuk tujuan pengenalan dan bukan saran keuangan atau rekomendasi. Seluruh teks dan bagiannya, serta grafik tidak dapat dianggap sebagai tawaran untuk membuat kesepakatan dengan aset apa pun. Pasar IFC dan karyawannya dalam kondisi apapun tidak bertanggung jawab atas tindakan yang dilakukan oleh orang lain selama atau setelah membaca tinjauan.
