- Analisis
- Analisis teknis
Dow Jones Analisis teknis - Dow Jones Jual beli: 2019-02-07
Strong data bullish for DJI
Dow Jones Industrial Average, Stock market index Chart Analysis

Dow Jones Industrial Average, Stock market index Analisis Teknis
Continuing expansion in private sector indicates US economy is strong. Will the DJI continue the rebound?
Data after the Federal Reserve January 29-30 meeting were positive on balance indicating the US economy is strong. The Institute of Supply Management's manufacturing index’s final reading for January came in better than expected. The US economy created above-expected 304,000 new jobs in January as labor force participation rose. And while the services section expansion slowed in January, the expansion still continued at robust pace with employment and prices rising in the sector. The only weak spot were the drop in factory orders for November. Positive economic data are bullish for Dow Jones US stock index.
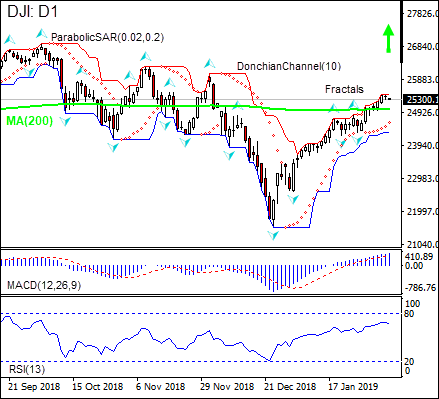
On the daily timeframe the DJI: D1 is above the 200-day moving average MA(200), this is bullish.
- The Parabolic indicator gives a buy signal.
- The Donchian channel indicates no trend yet: it is flat.
- The MACD indicator gives a bullish signal: it is above the signal line and the gap is widening.
- The RSI oscillator is falling but has not reached the oversold zone yet.
We believe the bullish momentum will continue after the price closes above the upper boundary of Donchian channel at 25434.7. This level can be used as an entry point for placing a pending order to buy. The stop loss can be placed below the fractal low at 24315.6. After placing the order, the stop loss is to be moved every day to the next fractal low, following Parabolic signals. Thus, we are changing the expected profit/loss ratio to the breakeven point. If the price meets the stop loss level (24315.6) without reaching the order (25434.7), we recommend cancelling the order: the market has undergone internal changes which were not taken into account.
Technical Analysis Summary
| Position | Buy |
| Buy stop | Above 25434.7 |
| Stop loss | Below 24315.6 |
Fundamental Analysis - "}[/T]
- Get Certificate

Perhatian:
Tinjauan ini memiliki karakter informatif dan tutorial dan dipublikasikan secara gratis. Semua data, termasuk dalam Tinjauan, diterima dari sumber publik, diakui kurang lebih dapat diandalkan. Apalagi, tidak ada jaminan bahwa informasi yang ditunjukkan penuh dan tepat. tinjauan tidak diperbarui. Keseluruhan informasi dalam setiap tinjauan, termasuk pendapat, indikator, grafik dan hal lainnya, disediakan hanya untuk tujuan pengenalan dan bukan saran keuangan atau rekomendasi. Seluruh teks dan bagiannya, serta grafik tidak dapat dianggap sebagai tawaran untuk membuat kesepakatan dengan aset apa pun. Pasar IFC dan karyawannya dalam kondisi apapun tidak bertanggung jawab atas tindakan yang dilakukan oleh orang lain selama atau setelah membaca tinjauan.
