- Analisis
- Analisis teknis
Indeks Euro Stoxx 50 Analisis teknis - Indeks Euro Stoxx 50 Jual beli: 2019-08-16
Weak euro-zone data bearish for EU50
Euro-zone economy slowed in second quarter. Will the EU50 decline continue?
Euro-zone economic data have been negative recently: economic growth in euro area slowed in the second quarter, with German economy contracting. Economic data released on Wednesday showed euro zone GDP grew by just 0.2% quarter-on-quarter, after 0.4% growth reported in the first three months of the year. At the same time Germany’s gross domestic product shrank by 0.1% between April and June. And against the background of uncertain prospects of global growth the continuing US-China trade dispute and the increasing likelihood of a no-deal Brexit are additional downside risks for euro-zone economy.
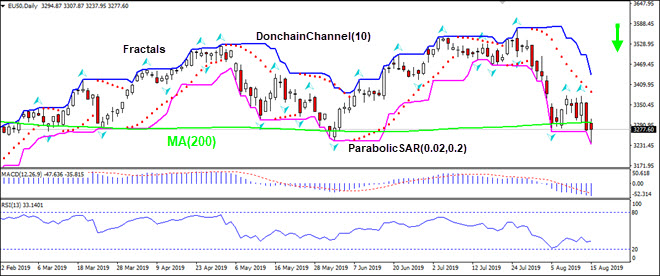
On the daily timeframe EU50: D1 has closed below 200-day moving average MA(200).
- The Parabolic indicator has formed a sell signal.
- The Donchian channel indicates downtrend: it is tilted down.
- The MACD indicator is below the signal line with the gap widening. This is a bearish signal.
- The RSI oscillator is rising but has not reached the overbought zone.
We believe the bearish momentum will continue after the price breaches below the lower Donchian boundary at 3234.01. This level can be used as an entry point for placing a pending order to sell. The stop loss can be placed above the fractal high at 3375.08. After placing the pending order the stop loss is to be moved every day to the next fractal high, following Parabolic signals. Thus, we are changing the expected profit/loss ratio to the breakeven point. If the price meets the stop-loss level (3375.08) without reaching the order (3234.01) we recommend cancelling the order: the market sustains internal changes which were not taken into account.
Technical Analysis Summary
| Order | Sell |
| Sell Stop | Below 3234.01 |
| Stop loss | Above 3375.08 |
- Get Certificate

Perhatian:
Tinjauan ini memiliki karakter informatif dan tutorial dan dipublikasikan secara gratis. Semua data, termasuk dalam Tinjauan, diterima dari sumber publik, diakui kurang lebih dapat diandalkan. Apalagi, tidak ada jaminan bahwa informasi yang ditunjukkan penuh dan tepat. tinjauan tidak diperbarui. Keseluruhan informasi dalam setiap tinjauan, termasuk pendapat, indikator, grafik dan hal lainnya, disediakan hanya untuk tujuan pengenalan dan bukan saran keuangan atau rekomendasi. Seluruh teks dan bagiannya, serta grafik tidak dapat dianggap sebagai tawaran untuk membuat kesepakatan dengan aset apa pun. Pasar IFC dan karyawannya dalam kondisi apapun tidak bertanggung jawab atas tindakan yang dilakukan oleh orang lain selama atau setelah membaca tinjauan.
