- Analisis
- Analisis teknis
CAC 40 Analisis teknis - CAC 40 Jual beli: 2019-06-20
Positive data bullish for FR40
French retail sales increase and private business sector expansion were better than expected. Will the FR40 advance continue?
Recent French economic data were better than expected after final Q1 GDP report: Markit’s final reading of composite purchasing managers index for May confirmed business activity expansion accelerated in May with services sector also recording an expansion. And retail sales growth increased in April: retail sales rose 3.1% over year after 1.2% increase in March. At the same time trade deficit declined to 5 billion euro from 5.5 billion in March. Positive French data are bullish for FR40.
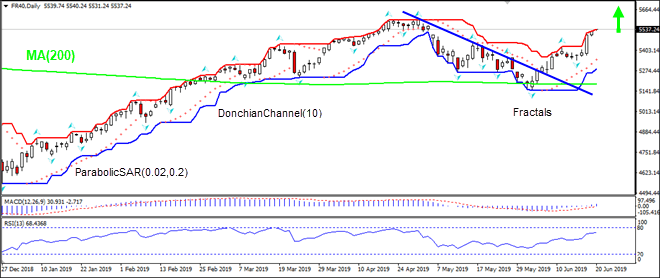
On the daily timeframe FR40: D1 is retracing higher after hitting 4-month low in the beginning of June, and has risen above the 200-day moving average MA(200). The price is rising after breaching above the resistance line. These are bullish developments.
- The Parabolic indicator has formed a buy signal.
- The Donchian channel indicates uptrend: it is tilted up.
- The MACD indicator is above the signal line with the gap widening. This is a bullish signal.
- The RSI oscillator is reaching overbought zone but has not yet breached into it.
We believe the bullish momentum will continue after the price breaches above the upper Donchian boundary at 5540.24. This level can be used as an entry point for placing a pending order to buy. The stop loss can be placed below the lower fractal at 5339.66. After placing the pending order the stop loss is to be moved every day to the next fractal low, following Parabolic signals. Thus, we are changing the expected profit/loss ratio to the breakeven point. If the price meets the stop-loss level (5339.66) without reaching the order (5540.24) we recommend cancelling the order: the market sustains internal changes which were not taken into account.
Technical Analysis Summary
| Order | Buy |
| Buy Stop | Above 5540.24 |
| Stop loss | Below 5339.66 |
- Get Certificate

Perhatian:
Tinjauan ini memiliki karakter informatif dan tutorial dan dipublikasikan secara gratis. Semua data, termasuk dalam Tinjauan, diterima dari sumber publik, diakui kurang lebih dapat diandalkan. Apalagi, tidak ada jaminan bahwa informasi yang ditunjukkan penuh dan tepat. tinjauan tidak diperbarui. Keseluruhan informasi dalam setiap tinjauan, termasuk pendapat, indikator, grafik dan hal lainnya, disediakan hanya untuk tujuan pengenalan dan bukan saran keuangan atau rekomendasi. Seluruh teks dan bagiannya, serta grafik tidak dapat dianggap sebagai tawaran untuk membuat kesepakatan dengan aset apa pun. Pasar IFC dan karyawannya dalam kondisi apapun tidak bertanggung jawab atas tindakan yang dilakukan oleh orang lain selama atau setelah membaca tinjauan.
