- Analisis
- Analisis teknis
GBP/USD Analisis teknis - GBP/USD Jual beli: 2014-12-01
OPEC: dollar appreciation
The fallen oil futures prices after the OPEC meeting resulted in a significant depreciation of commodity currencies against the US dollar: it was in favour of USD and led to a significant strengthening of the dollar index. Today at 14:00 CET we expect the monthly release of ISM Manufacturing PMI in the United States. This diffusion index is based on a survey of 400 purchasing managers in the manufacturing industry, which evaluate employment, output volume, orders and stockpiles. It is the most important economic indicator as it permits obtaining preliminary information on manufacturing activity which affects the investor optimism. In our opinion, the greatest volatility is expected today from the US currency relative to other liquid instruments of the currency market.
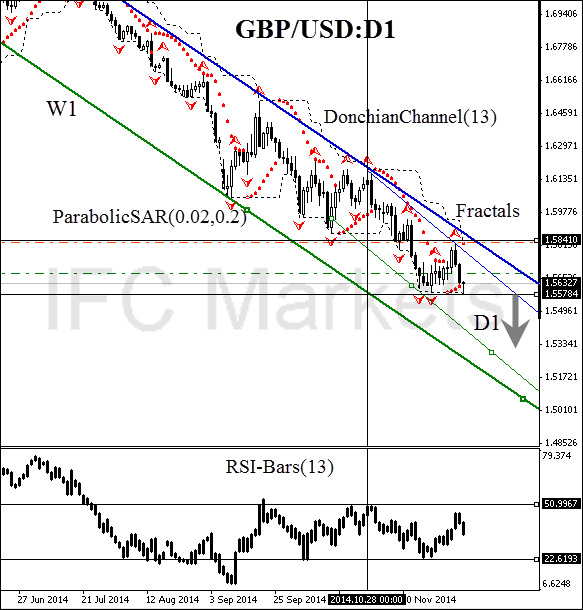
| Position | Sell |
| Sell stop | below 1.55784 |
| Stop loss | above 1.58410 |
Dear traders. For the detailed report of the strategy based on analytical issues of technical analysis click here.
- Get Certificate

Perhatian:
Tinjauan ini memiliki karakter informatif dan tutorial dan dipublikasikan secara gratis. Semua data, termasuk dalam Tinjauan, diterima dari sumber publik, diakui kurang lebih dapat diandalkan. Apalagi, tidak ada jaminan bahwa informasi yang ditunjukkan penuh dan tepat. tinjauan tidak diperbarui. Keseluruhan informasi dalam setiap tinjauan, termasuk pendapat, indikator, grafik dan hal lainnya, disediakan hanya untuk tujuan pengenalan dan bukan saran keuangan atau rekomendasi. Seluruh teks dan bagiannya, serta grafik tidak dapat dianggap sebagai tawaran untuk membuat kesepakatan dengan aset apa pun. Pasar IFC dan karyawannya dalam kondisi apapun tidak bertanggung jawab atas tindakan yang dilakukan oleh orang lain selama atau setelah membaca tinjauan.
