- Analisis
- Analisis teknis
Hang Seng Analisis teknis - Hang Seng Jual beli: 2019-08-22
HK50 technical setup turns bullish
Hong Kong inflation remained steady in July while unemployment ticked up. Will the HK50 advance continue?
Hong Kong economic data have been weak on balance recently: unemployment ticked up to 2.9% in July from 2.8%, the Q2 GDP contraction was revised downward to 0.4% decline from 0.3% of advance reading. However foreign exchange reserves rose while inflation remained steady at 3.3% when a decline to 2.8% was forecast. All these data were recorded against the background of contraction in the private sector activities as evidenced by decline in Markit’s PMI to 43.8 from 47.9 in June: readings above 50.0 indicate sector expansion, and contraction below. Deteriorated US-China trade relations are main reason for slowing of activities. However technical indicators point to upside momentum for Hong Kong stock market. And unresolved US-China trade dispute remains a downside risk for Hong Kong stock market.
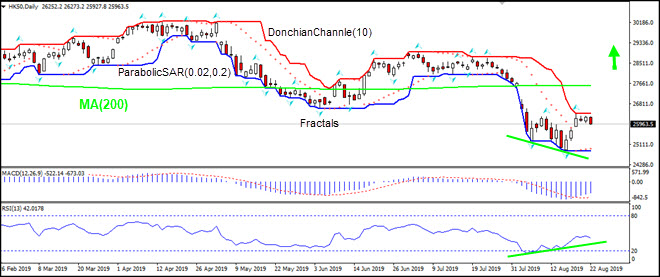
On the daily timeframe HK50: D1 is retracing higher after hitting 10-month low, still below the 200-day moving average MA(200), which is level.
- The Parabolic indicator has formed a buy signal.
- The Donchian channel indicates no trend yet: it is flat.
- The MACD indicator is below the signal line with the gap narrowing. This is a bullish signal.
- The RSI oscillator has not reached the overbought zone and has formed a bullish divergence.
We believe the bullish momentum will continue after the price breaches above the upper Donchian boundary at 26401.10. This level can be used as an entry point for placing a pending order to buy. The stop loss can be placed below the lower fractal at 24850.00. After placing the pending order the stop loss is to be moved every day to the next fractal low, following Parabolic signals. Thus, we are changing the expected profit/loss ratio to the breakeven point. If the price meets the stop-loss level (24850.00) without reaching the order (26401.10) we recommend cancelling the order: the market sustains internal changes which were not taken into account.
Technical Analysis Summary
| Order | Buy |
| Buy Stop | Above 26401.10 |
| Stop loss | Below 24850.00 |
- Get Certificate

Perhatian:
Tinjauan ini memiliki karakter informatif dan tutorial dan dipublikasikan secara gratis. Semua data, termasuk dalam Tinjauan, diterima dari sumber publik, diakui kurang lebih dapat diandalkan. Apalagi, tidak ada jaminan bahwa informasi yang ditunjukkan penuh dan tepat. tinjauan tidak diperbarui. Keseluruhan informasi dalam setiap tinjauan, termasuk pendapat, indikator, grafik dan hal lainnya, disediakan hanya untuk tujuan pengenalan dan bukan saran keuangan atau rekomendasi. Seluruh teks dan bagiannya, serta grafik tidak dapat dianggap sebagai tawaran untuk membuat kesepakatan dengan aset apa pun. Pasar IFC dan karyawannya dalam kondisi apapun tidak bertanggung jawab atas tindakan yang dilakukan oleh orang lain selama atau setelah membaca tinjauan.
