- Analisis
- Analisis teknis
Infineon Technologies AG Analisis teknis - Infineon Technologies AG Jual beli: 2019-05-23
Lower sales forecast bearish for Infineon price
Infineon stock led technology sector rout after news the company had stopped shipments to Huawei. Will the Infineon price continue declining?
infineon Technologies AG stock slump led euro-zone technology retreat on Monday after news infineon had suspended shipments to Huawei following US ban on exports to China’s telecom giant. Couple of weeks before that company’s stock fell after Infineon reported no growth in revenue in the second quarter, though forecast a 5% rise in revenue to 8 billion euros ($8.96 billion) in the year to September 30. Chips used in cars account for more than two-fifths of Infineon's top selling output, and the company cited weaker Chinese demand for stagnant sales. It forecast “lower than normal seasonal revenue increase int the second half of the 2019 fiscal year”. Lower revenue forecast is bearish for Infineon stock price.
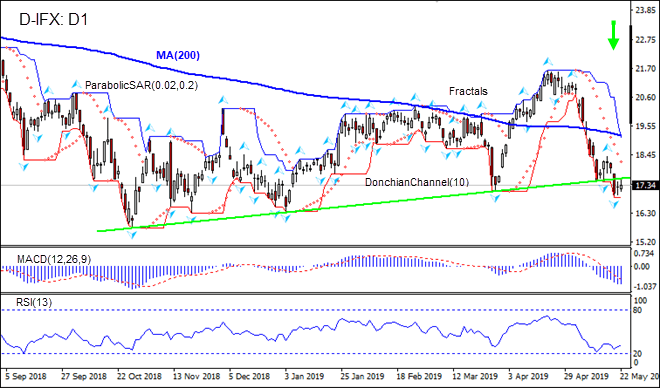
On the daily timeframe the D-IFX: D1 is below the 200-day moving average MA(200) which is falling. The price has breached below the support line. These are bearish.
- The Parabolic indicator gives a sell signal.
- The Donchian channel indicates downtrend: it is tilted lower.
- The MACD indicator gives a bearish signal: it is below the signal line and the gap is widening.
- The RSI oscillator is rising after failing to breach into the oversold zone.
We believe the bearish momentum will continue after the price breaches below the lower boundary of Donchian channel at 16.87. This level can be used as an entry point for placing a pending order to sell. The stop loss can be placed above the fractal high at 18.41. After placing the order, the stop loss is to be moved every day to the next fractal high, following Parabolic signals. Thus, we are changing the expected profit/loss ratio to the breakeven point. If the price meets the stop loss level (18.41) without reaching the order (16.87), we recommend cancelling the order: the market has undergone internal changes which were not taken into account.
Technical Analysis Summary
| Position | Sell |
| Sell stop | Below 16.87 |
| Stop loss | Above 18.41 |
- Get Certificate

Perhatian:
Tinjauan ini memiliki karakter informatif dan tutorial dan dipublikasikan secara gratis. Semua data, termasuk dalam Tinjauan, diterima dari sumber publik, diakui kurang lebih dapat diandalkan. Apalagi, tidak ada jaminan bahwa informasi yang ditunjukkan penuh dan tepat. tinjauan tidak diperbarui. Keseluruhan informasi dalam setiap tinjauan, termasuk pendapat, indikator, grafik dan hal lainnya, disediakan hanya untuk tujuan pengenalan dan bukan saran keuangan atau rekomendasi. Seluruh teks dan bagiannya, serta grafik tidak dapat dianggap sebagai tawaran untuk membuat kesepakatan dengan aset apa pun. Pasar IFC dan karyawannya dalam kondisi apapun tidak bertanggung jawab atas tindakan yang dilakukan oleh orang lain selama atau setelah membaca tinjauan.
