- Analisis
- Analisis teknis
Natural gas vs Russian ruble Analisis teknis - Natural gas vs Russian ruble Jual beli: 2019-10-15
U.S. Liquefied Natural Gas Exports Reveals Historical High
In this review, we suggest to consider the Gas vs Ruble Personal Composite Instrument (PCI). It reflects the price dynamics of US natural gas against the Russian ruble. Will the GAS/RUB quotations grow?
Such a movement indicates that natural gas in the USA is getting more expensive, and the ruble is weakening. The main factor behind the possible increase in US gas quotes is an increase in the export of liquefied natural gas (LNG) to 7 billion cubic feet per day on Monday, October 14. This is a new historic high. High demand for LNG may continue, as in the USA it costs about $ 2.2 per million British thermal units, and in Europe - $ 3.4, which is more than the cost of transportation. Factors of a possible weakening of the Russian ruble are the plans of the Central Bank of the Russian Federation to continue lowering the rate, as well as the aggravation of the political situation in Syria and the associated risks. Now the CBR rate is 7% with inflation 4%. Its next meeting will be held on October 25th.
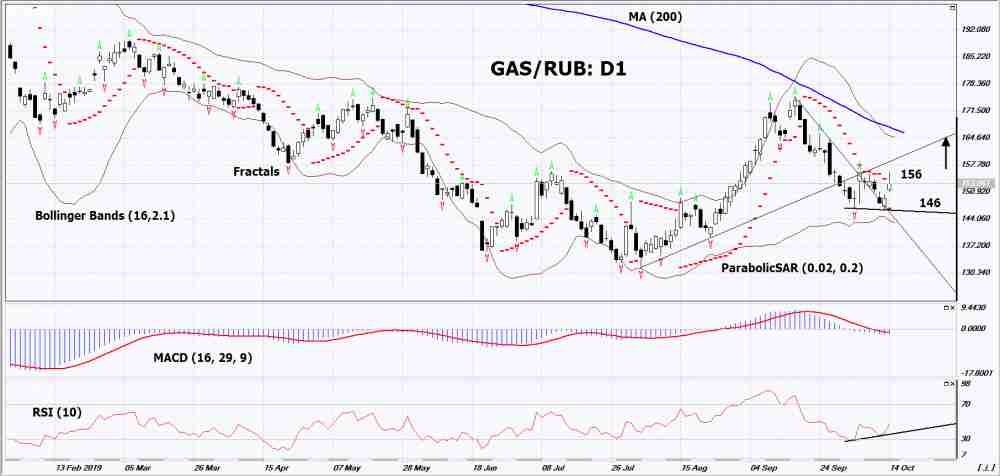
On the daily timeframe GAS/RUB: D1 has moved into a short-term neutral trend. Various technical analysis indicators have generated signals to increase. Further growth of quotations is possible in case of increased demand for gas in the United States and the weakening of the Russian ruble.
- The Parabolic indicator demonstrates a signal to increase.
- The Bolinger bands widened, indicating high volatility.
- The RSI indicator is below the 50 mark. It has formed a divergence to increase.
- The MACD indicator demonstrates a weak signal to increase, but has not yet turned up.
The bullish momentum may develop if GAS/RUB exceeds its last upper fractal: 156. This level can be used as an entry point. The initial stop lose may be placed below the last lower fractal and the Parabolic signal: 146. After opening a pending order, the stop shall be moved, following the Bollinger and Parabolic signals, to the next fractal minimum. Thus, we are changing the potential profit/loss to the breakeven point. More risk-averse traders may switch to the 4-hour chart after the trade and place a stop loss moving it in the direction of the trade. If the price meets the stop level (146) without reaching the order (156), we recommend to cancel the order: the market sustains internal changes that were not taken into account.
Technical Analysis Summary
| Position | Buy |
| Buy stop | Above 156 |
| Stop loss | Below 146 |
- Get Certificate

Perhatian:
Tinjauan ini memiliki karakter informatif dan tutorial dan dipublikasikan secara gratis. Semua data, termasuk dalam Tinjauan, diterima dari sumber publik, diakui kurang lebih dapat diandalkan. Apalagi, tidak ada jaminan bahwa informasi yang ditunjukkan penuh dan tepat. tinjauan tidak diperbarui. Keseluruhan informasi dalam setiap tinjauan, termasuk pendapat, indikator, grafik dan hal lainnya, disediakan hanya untuk tujuan pengenalan dan bukan saran keuangan atau rekomendasi. Seluruh teks dan bagiannya, serta grafik tidak dapat dianggap sebagai tawaran untuk membuat kesepakatan dengan aset apa pun. Pasar IFC dan karyawannya dalam kondisi apapun tidak bertanggung jawab atas tindakan yang dilakukan oleh orang lain selama atau setelah membaca tinjauan.
