- Analisis
- Analisis teknis
Nikkei Analisis teknis - Nikkei Jual beli: 2019-01-17
Increasing bank lending bullish for NIKKEI
Japanese bank lending increased in December. Will the NIKKEI continue rising?
Recent Japanese economic data were positive: while the growth in core machinery orders slowed in November from 4.5% over year in October, it still amounted to 0.8% instead of expected 0.2%. At the same time bank lending increased more than expected: from 2.1% over year in November to 2.4% in December, above expectations of a 2.2% increase. And as Chinese delegation plans to visit Washington in the end of January to continue US-China trade talks and Beijing pledging to provide fiscal and monetary stimulus for its economy to boost the slowing growth, the outlook for global economic growth is being upgraded, adding to investors optimism. Improving business optimism is bullish for NIKKEI.
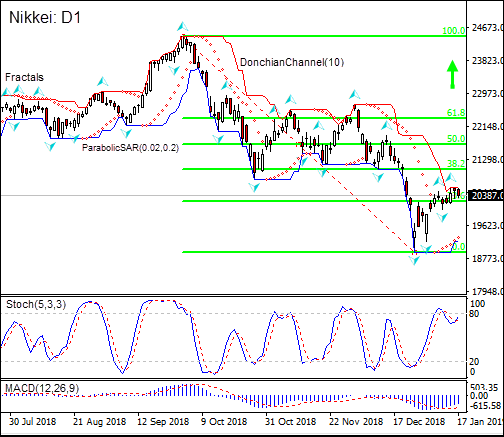
On the daily timeframe the Nikkei: D1 is rising after hitting 19-mont low in the end of December. The price is above the 23.6 Fibonacci level, this is bullish.
- The Parabolic indicator gives a buy signal.
- The Donchian channel indicates uptrend: it is narrowing up.
- The MACD indicator gives a bullish signal: it is below the signal line and the gap is narrowing.
- The Stochastic oscillator is rising but has not reached the overbought zone yet.
We believe the bullish momentum will continue after the price closes above the upper boundary of Donchian channel at 20574.5. This level can be used as an entry point for placing a pending order to buy. The stop loss can be placed below the fractal low at 20033.0. After placing the order, the stop loss is to be moved every day to the next fractal low, following Parabolic signals. Thus, we are changing the expected profit/loss ratio to the breakeven point. If the price meets the stop loss level (20033.0) without reaching the order (20574.5), we recommend cancelling the order: the market has undergone internal changes which were not taken into account.
Technical Analysis Summary
| Position | Buy |
| Buy stop | Above 20574.5 |
| Stop loss | Below 20033.0 |
- Get Certificate

Perhatian:
Tinjauan ini memiliki karakter informatif dan tutorial dan dipublikasikan secara gratis. Semua data, termasuk dalam Tinjauan, diterima dari sumber publik, diakui kurang lebih dapat diandalkan. Apalagi, tidak ada jaminan bahwa informasi yang ditunjukkan penuh dan tepat. tinjauan tidak diperbarui. Keseluruhan informasi dalam setiap tinjauan, termasuk pendapat, indikator, grafik dan hal lainnya, disediakan hanya untuk tujuan pengenalan dan bukan saran keuangan atau rekomendasi. Seluruh teks dan bagiannya, serta grafik tidak dapat dianggap sebagai tawaran untuk membuat kesepakatan dengan aset apa pun. Pasar IFC dan karyawannya dalam kondisi apapun tidak bertanggung jawab atas tindakan yang dilakukan oleh orang lain selama atau setelah membaca tinjauan.
