- Analisis
- Analisis teknis
Nvidia Corp. Analisis teknis - Nvidia Corp. Jual beli: 2019-05-16
Lower sales expectations bearish for Nvidia price
Nvidia corporation is forecast to report first quarter revenue drop of over 30%. Will the Nvidia price continue declining?
Nvidia Corporation is expected to report first quarter revenue drop - more than 31% year over year to $2.2 billion. Among the reasons for the expected drop are weak graphics processing unit (GPU) demand and loss of Tesla business. NVIDIA's gaming business is its biggest source of revenue, accounting for about 43% of total sales. As a result, the company's earnings are expected to drop to $0.79 per share in the first quarter, down from $2.05 per share a year ago. Lower revenue forecast is bearish for Nvidia stock price. On the other hand, a surprise in the form of not such a sharp decline in revenue is an upside risk which might boost the stock price.
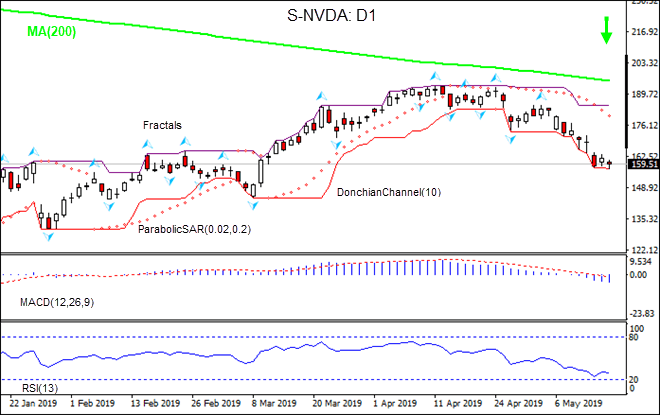
On the daily timeframe the S-NVDA: D1 is below the 200-day moving average MA(200) which is falling. This is bearish.
- The Parabolic indicator gives a sell signal.
- The Donchian channel indicates downtrend: it is tilted lower.
- The MACD indicator gives a bearish signal: it is below the signal line and the gap is widening.
- The RSI oscillator is falling but has not breached into the oversold zone yet.
We believe the bearish momentum will continue after the price breaches below the lower boundary of Donchian channel at 157.4. This level can be used as an entry point for placing a pending order to sell. The stop loss can be placed above the fractal high at 184.8. After placing the order, the stop loss is to be moved every day to the next fractal high, following Parabolic signals. Thus, we are changing the expected profit/loss ratio to the breakeven point. If the price meets the stop loss level (184.8) without reaching the order (157.4), we recommend cancelling the order: the market has undergone internal changes which were not taken into account.
Technical Analysis Summary
| Position | Sell |
| Sell stop | Below 157.4 |
| Stop loss | Above 184.8 |
- Get Certificate

Perhatian:
Tinjauan ini memiliki karakter informatif dan tutorial dan dipublikasikan secara gratis. Semua data, termasuk dalam Tinjauan, diterima dari sumber publik, diakui kurang lebih dapat diandalkan. Apalagi, tidak ada jaminan bahwa informasi yang ditunjukkan penuh dan tepat. tinjauan tidak diperbarui. Keseluruhan informasi dalam setiap tinjauan, termasuk pendapat, indikator, grafik dan hal lainnya, disediakan hanya untuk tujuan pengenalan dan bukan saran keuangan atau rekomendasi. Seluruh teks dan bagiannya, serta grafik tidak dapat dianggap sebagai tawaran untuk membuat kesepakatan dengan aset apa pun. Pasar IFC dan karyawannya dalam kondisi apapun tidak bertanggung jawab atas tindakan yang dilakukan oleh orang lain selama atau setelah membaca tinjauan.
