- Analisis
- Analisis teknis
Wheat vs Canadian dollar Analisis teknis - Wheat vs Canadian dollar Jual beli: 2019-08-12
Weak macro-economic data were released in Canada
In this review, we suggest considering a personal composite instrument (PCI) “Wheat against Canadian dollar”. It rises with gains in wheat price on global market and weakening of Canadian dollar. Will the WHEAT/CAD price increase?
Publication of weak macro data may be a negative factor for Canadian dollar. Unemployment rose to 5.7% in July from 5.5% in June. Employment shrank by 242000. It was worse than expected. Data indicating a decline in building permits were released earlier. Declining crude oil prices may additionally contribute to weakening of Canadian dollar. In past four weeks Brent has fallen 12%. The next Bank of Canada meeting is scheduled for September 4. The likelihood of a quarter point rate cut from current 1.75% is estimated at 23%. Wheat has been rising against the background of rising global demand and drought in US. According to the USDA the US wheat export rose 27% last week and was above 4-week average by 17%. Saudi Arabia loosened its wheat import requirements to allow purchases not only of European but also Russian wheat. And Japan Meteorology Agency said the likelihood of unfavorable weather conditions due to formation of El Nino or La Nina is 60%.
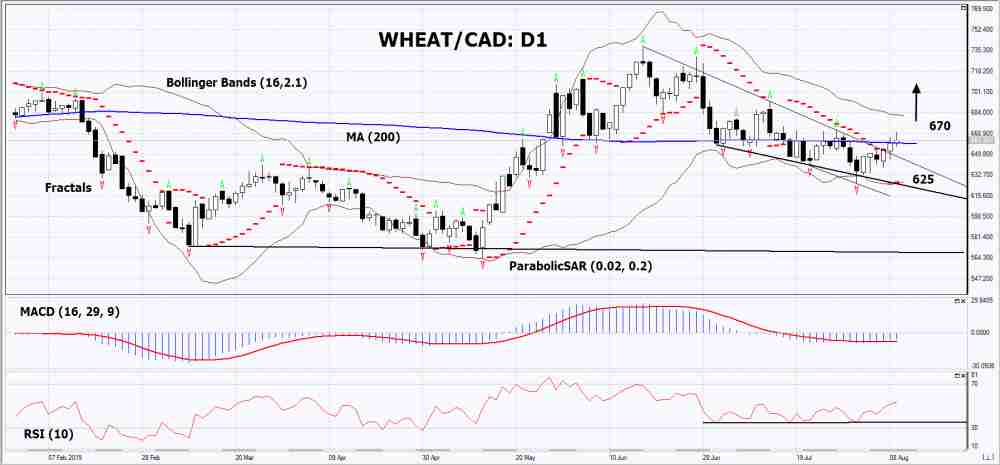
On the daily timeframe WHEAT/CAD: D1 has breached above the resistance line of the downtrend and risen above 200-day moving average MA(200). Some technical analysis indicators have formed bullish signal. Further gain in price is possible in case of wheat shaortage.
- The Parabolic indicator gives bullish signal.
- The Bollinger bands have widened, indicating a volatility increase. Both Bollinger Lines slope upward.
- The RSI indicator is above the 50 mark . It has formed a bullish divergence.
- The MACD indicator gives a bullish signal.
We don’t exclude bullish movement if WHEAT/CAD rises above last fractal high: 670. This level can be used as an entry point. The initial stop loss may be placed below the last fractal low, Bollinger lower line and Parabolic signal: 625. After opening the pending order, the stop shall be moved following the signals of Bollinger and Parabolic to the next fractal low. Thus, we are changing the potential profit/loss to the breakeven point. More risk-averse traders may switch to the 4-hour chart after the trade and place a stop loss moving it in the direction of the trade. If the price meets the stop level (625) without reaching the order (670), we recommend to cancel the order: the market sustains internal changes that were not taken into account.
Technical Analysis Summary
| Position | Buy |
| Buy stop | Above 670 |
| Stop loss | Below 625 |
- Get Certificate

Perhatian:
Tinjauan ini memiliki karakter informatif dan tutorial dan dipublikasikan secara gratis. Semua data, termasuk dalam Tinjauan, diterima dari sumber publik, diakui kurang lebih dapat diandalkan. Apalagi, tidak ada jaminan bahwa informasi yang ditunjukkan penuh dan tepat. tinjauan tidak diperbarui. Keseluruhan informasi dalam setiap tinjauan, termasuk pendapat, indikator, grafik dan hal lainnya, disediakan hanya untuk tujuan pengenalan dan bukan saran keuangan atau rekomendasi. Seluruh teks dan bagiannya, serta grafik tidak dapat dianggap sebagai tawaran untuk membuat kesepakatan dengan aset apa pun. Pasar IFC dan karyawannya dalam kondisi apapun tidak bertanggung jawab atas tindakan yang dilakukan oleh orang lain selama atau setelah membaca tinjauan.
