- Analisis
- Analisis teknis
Platinum Analisis teknis - Platinum Jual beli: 2018-06-13
An increase in the global platinum deficit is expected this year
Platinum Guild India expects an increase in the demand for platinum by 25% for the Indian jewelry industry in the current year. Will platinum prices rise?
In the world demand for this metal, the needs of the jewelry industry are 28%. Platinum is used mainly in the production of catalysts for diesel engines of cars. 42% of the global demand is accounted for these purposes. It should be noted that despite the scandal with diesel engines of the German company Volkswagen and the reduction of diesel cars in developed countries, the demand for platinum in the global automotive industry grew by 2% in 2017. The GFMS agency forecasts an increase in the world platinum deficit in the current year for the fifth consecutive year - up to 280 thousand ounces from 53 thousand ounces last year. The main reason for this may be the reduction in its world production by 2.5% because of the problems with mining companies in South Africa. On Wednesday, June 13, 2018, the US Fed meeting will take place, during which a rate hike to 2% from its present level of 1.75% is expected. Market participants believe that after this, the American regulator will pause the tightening of the monetary policy. Fed comments can affect the dynamics of precious metals.
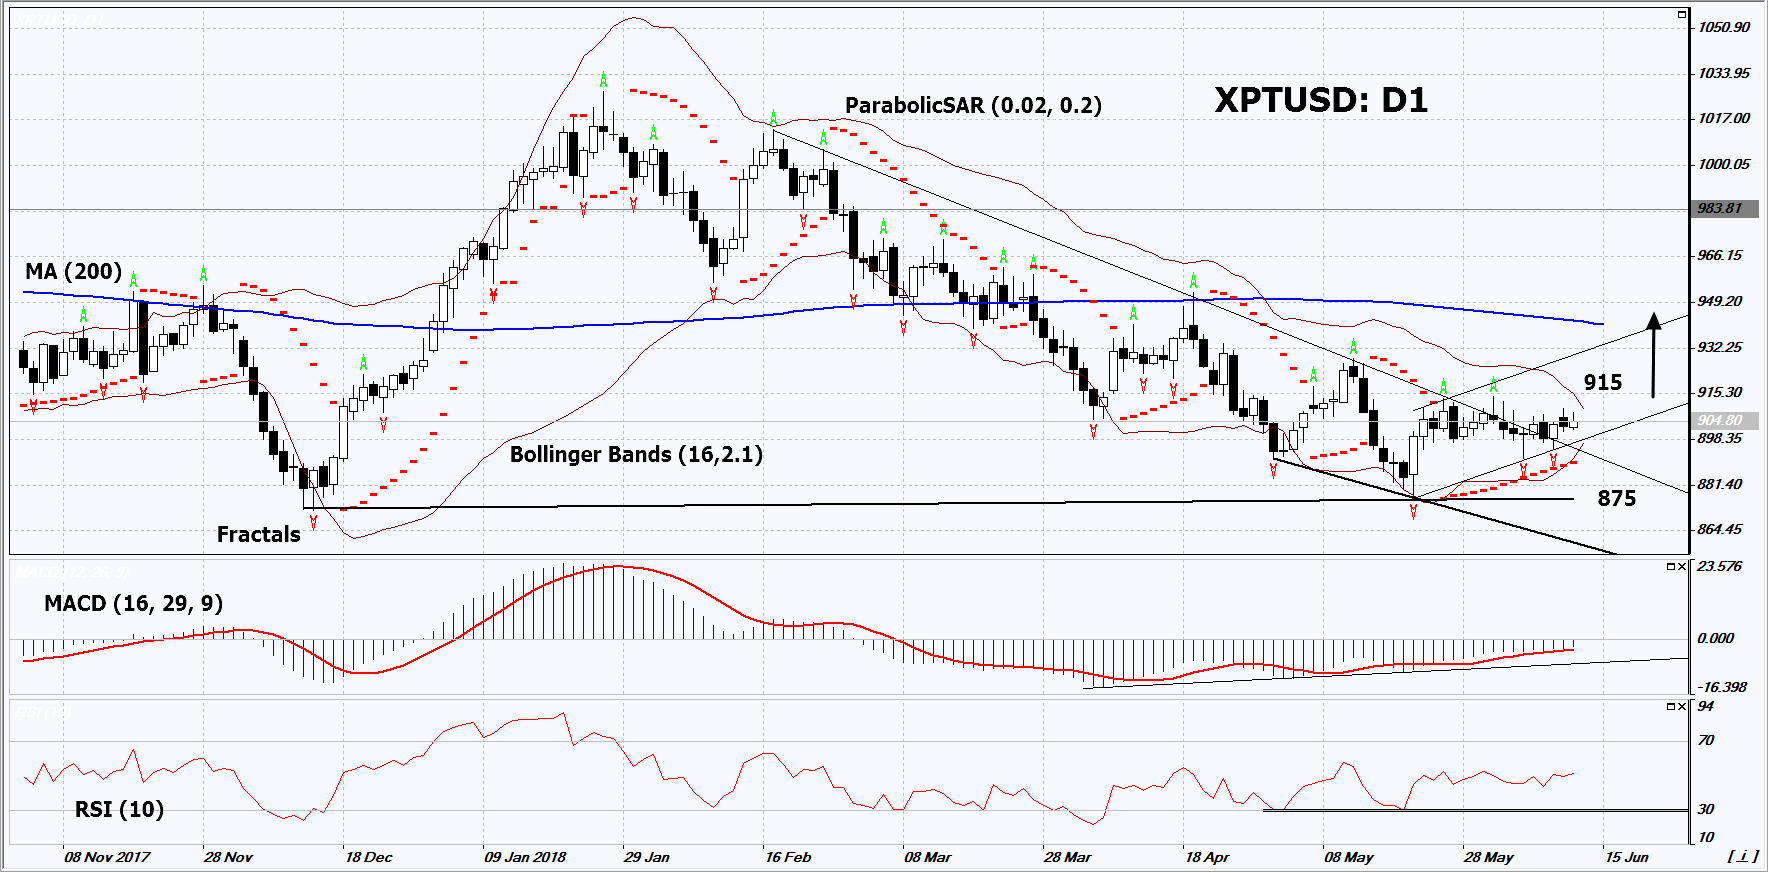
On the daily timeframe, XPTUSD: D1 formed a double bottom and then exited the downtrend. The price growth is possible in case of an increase in global demand and weakening of the US dollar.
- The Parabolic indicator gives a bullish signal.
- The Bollinger bands have extremely narrowed, which indicates very low volatility.
- The RSI indicator is above 50. It has formed a weak, positive divergence.
- The MACD indicator gives a bullish signal.
The bullish momentum may develop in case XPTUSD exceeds its last fractal high and the upper Bollinger band at 915. This level may serve as an entry point. The initial stop loss may be placed below the three last fractal lows, the 6-month low, the lower Bollinger band and the Parabolic signal at 875. After opening the pending order, we shall move the stop to the next fractal low following the Bollinger and Parabolic signals. Thus, we are changing the potential profit/loss to the breakeven point. More risk-averse traders may switch to the 4-hour chart after the trade and place there a stop loss moving it in the direction of the trade. If the price meets the stop level at 915 without reaching the order at 875, we recommend to close the position: the market sustains internal changes that were not taken into account.
Summary of technical analysis
| Position | Buy |
| Buy stop | Above 915 |
| Stop loss | Below 875 |
- Get Certificate

Perhatian:
Tinjauan ini memiliki karakter informatif dan tutorial dan dipublikasikan secara gratis. Semua data, termasuk dalam Tinjauan, diterima dari sumber publik, diakui kurang lebih dapat diandalkan. Apalagi, tidak ada jaminan bahwa informasi yang ditunjukkan penuh dan tepat. tinjauan tidak diperbarui. Keseluruhan informasi dalam setiap tinjauan, termasuk pendapat, indikator, grafik dan hal lainnya, disediakan hanya untuk tujuan pengenalan dan bukan saran keuangan atau rekomendasi. Seluruh teks dan bagiannya, serta grafik tidak dapat dianggap sebagai tawaran untuk membuat kesepakatan dengan aset apa pun. Pasar IFC dan karyawannya dalam kondisi apapun tidak bertanggung jawab atas tindakan yang dilakukan oleh orang lain selama atau setelah membaca tinjauan.
