- Analisis
- Analisis teknis
Oil / Japanese Yen Analisis teknis - Oil / Japanese Yen Jual beli: 2019-11-18
Getting Ready for US-China Trade Talks
In this review, we suggest to consider the personal composite instrument (PCI) &WTI/JPY. It reflects the price dynamics of the portfolio of futures on WTI oil against the Japanese yen. Will the WTI/JPY rise??
Such dynamics means the weakening of the yen and strengthening of the oil. The dynamics of that PCI may depend on the success of US-Chinese trade talks. The Japanese yen, along with gold and the Swiss franc, is considered by investors as a “safe asset”. The demand of the Japanese yen may decline if the first phase of the trade agreement between the USA and China will be signed. At the same time, the demand of the oil may increase due to a decrease in risks for the global economy. During the last week, the economic adviser of the White House Larry Kudlow declared that there is a progress in trade talks between USA and China. The US Commerce Secretary Wilbur Ross expressed similar opinion. According to the International Energy Agency (IEA), the main increase of the oil production (at least 0.5 million barrels per day) should be executed by the countries who are non-OPEC members, such as USA, Brazil, Norway and Guyana by the next year. Meanwhile, oil production in the United States already reached a historic maximum at 13 million barrels per day (bwd). It is hard to state whether it will continue to grow. At the same time, the IEA expects an increase in the global oil demand by 6.6 million bwd in 2025. It may become the long-term factor in the stability of oil prices.
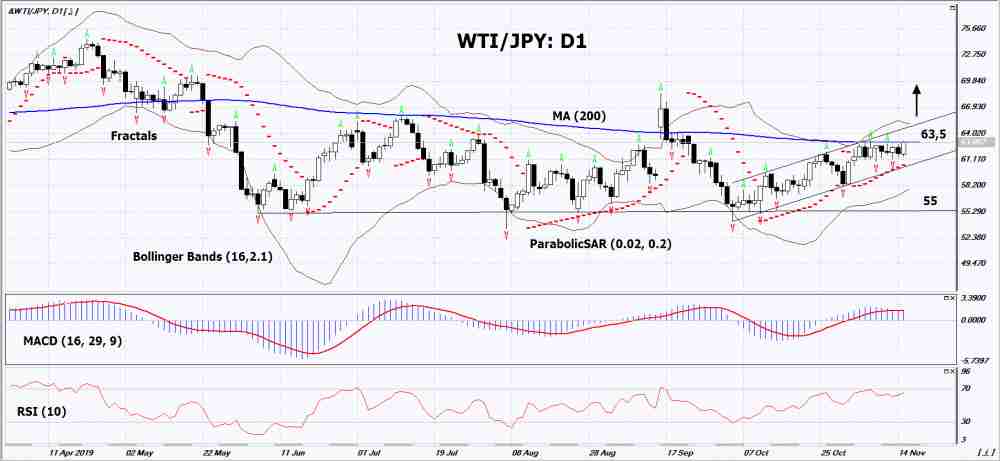
On the daily timeframe, WTI/JPY: D1 approached the upper boundary of the neutral trend, which aligns with the 200-day moving average line. Before opening a buy position, it must be broken up. Various technical analysis indicators have generated signals to increase. Further growth of quotations is possible in case of successful trade negotiations between the USA and China.
- The Parabolic indicator gives a bullish signal.
- The Bolinger bands narrowed, indicating a volatility decrease. The bottom line of the Bollinger has a slope up.
- The RSI indicator is above 50. No divergence.
- The MACD indicator gives a bullish signal.
The bullish momentum may develop in case if WTI/JPY will exceed its last two upper fractals and the 200-day moving average line: 63,5. This level may serve as an entry point. The initial stop loss may be placed below the Parabolic signal, the lower Bollinger band and the lower boundary of the neutral channel: 55. After opening the pending order, we shall move the stop to the next fractal low following the Bollinger and Parabolic signals. Thus, we are changing the potential profit/loss to the breakeven point. More risk-averse traders may switch to the 4-hour chart after the trade and place there a stop loss moving it in the direction of the trade. If the price meets the stop level (55) without reaching the order (63,5), we recommend to close the position: the market sustains internal changes that were not taken into account.
Summary of technical analysis
| Position | Buy |
| Buy stop | Above 63,5 |
| Stop loss | Below 55 |
Explore our
Trading Conditions
- Spreads from 0.0 pip
- 30,000+ Trading Instruments
- Stop Out Level - Only 10%
Ready to Trade?
Open Account Perhatian:
Tinjauan ini memiliki karakter informatif dan tutorial dan dipublikasikan secara gratis. Semua data, termasuk dalam Tinjauan, diterima dari sumber publik, diakui kurang lebih dapat diandalkan. Apalagi, tidak ada jaminan bahwa informasi yang ditunjukkan penuh dan tepat. tinjauan tidak diperbarui. Keseluruhan informasi dalam setiap tinjauan, termasuk pendapat, indikator, grafik dan hal lainnya, disediakan hanya untuk tujuan pengenalan dan bukan saran keuangan atau rekomendasi. Seluruh teks dan bagiannya, serta grafik tidak dapat dianggap sebagai tawaran untuk membuat kesepakatan dengan aset apa pun. Pasar IFC dan karyawannya dalam kondisi apapun tidak bertanggung jawab atas tindakan yang dilakukan oleh orang lain selama atau setelah membaca tinjauan.
