- Analisis
- Analisis teknis
Tembaga Analisis teknis - Tembaga Jual beli: 2020-12-10
Copper Technical Analysis Summary
Atas 3.5404
Buy Stop
Bawah 3.3570
Stop Loss
| Indicator | Signal |
| RSI | Neutral |
| MACD | Sell |
| Donchian Channel | Buy |
| MA(200) | Buy |
| Fractals | Buy |
| Parabolic SAR | Sell |
Copper Chart Analysis
Copper Analisis Teknis
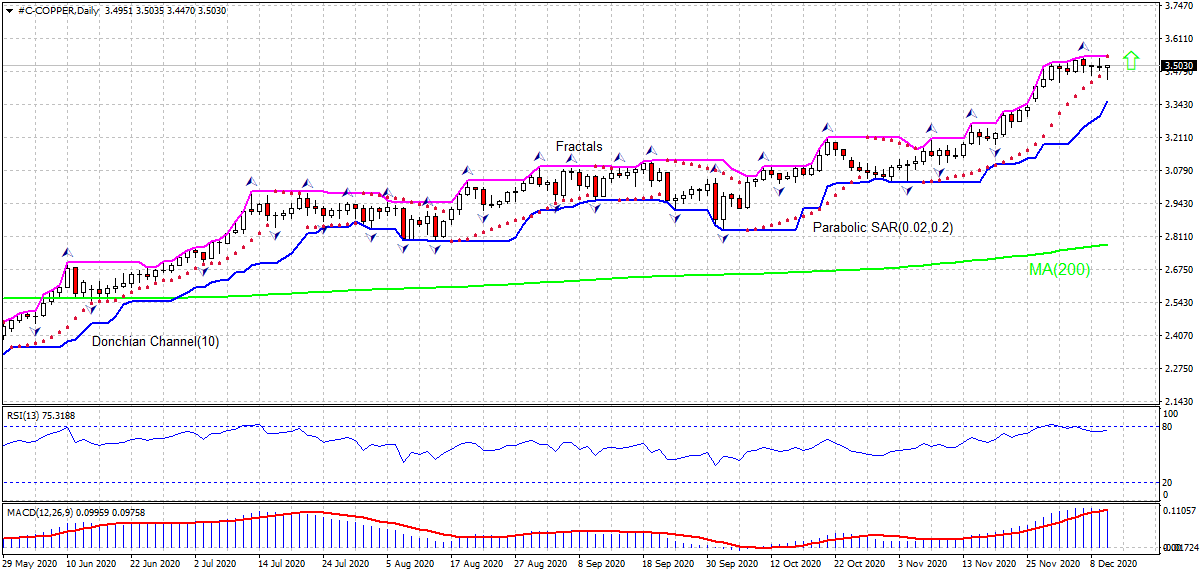
The COPPER technical analysis of the price chart in daily timeframe shows #C-COPPER: Daily is retracing down toward the 200-day moving average MA(200) after hitting seven year high on Monday. We believe the bullish momentum will continue as the price breaches above the upper Donchian boundary at 3.5404. A pending order to buy can be placed above that level. The stop loss can be placed below 3.3570. After placing the order, the stop loss is to be moved every day to the next fractal low indicator, following Parabolic signals. Thus, we are changing the expected profit/loss ratio to the breakeven point. If the price meets the stop loss level without reaching the order, we recommend cancelling the order: the market has undergone internal changes which were not taken into account.
Fundamental Analysis Komoditas - Copper
China’s copper imports are up compared with the previous year levels. Will the copper price advance continue?
China’s November imports of unwrought copper were up 16.2% from 483,000 in November last year, according to customs data. And for the first 11 months of 2020 imports were 6.17 million tons, up 38.7% from the same period last year. China is the world’s biggest consumer of copper, and high Chinese imports is bullish for copper. At the same time Chinese imports have slowed in monthly terms: unwrought copper imports were 561,311 tons, down 9.2% from October’s 618,108, second consecutive monthly decline. Slowing of Chinese demand is a downside risk for copper.
Explore our
Trading Conditions
- Spreads from 0.0 pip
- 30,000+ Trading Instruments
- Stop Out Level - Only 10%
Ready to Trade?
Open Account Perhatian:
Tinjauan ini memiliki karakter informatif dan tutorial dan dipublikasikan secara gratis. Semua data, termasuk dalam Tinjauan, diterima dari sumber publik, diakui kurang lebih dapat diandalkan. Apalagi, tidak ada jaminan bahwa informasi yang ditunjukkan penuh dan tepat. tinjauan tidak diperbarui. Keseluruhan informasi dalam setiap tinjauan, termasuk pendapat, indikator, grafik dan hal lainnya, disediakan hanya untuk tujuan pengenalan dan bukan saran keuangan atau rekomendasi. Seluruh teks dan bagiannya, serta grafik tidak dapat dianggap sebagai tawaran untuk membuat kesepakatan dengan aset apa pun. Pasar IFC dan karyawannya dalam kondisi apapun tidak bertanggung jawab atas tindakan yang dilakukan oleh orang lain selama atau setelah membaca tinjauan.

