- Analisis
- Analisis teknis
S&P 500 Analisis teknis - S&P 500 Jual beli: 2020-06-04
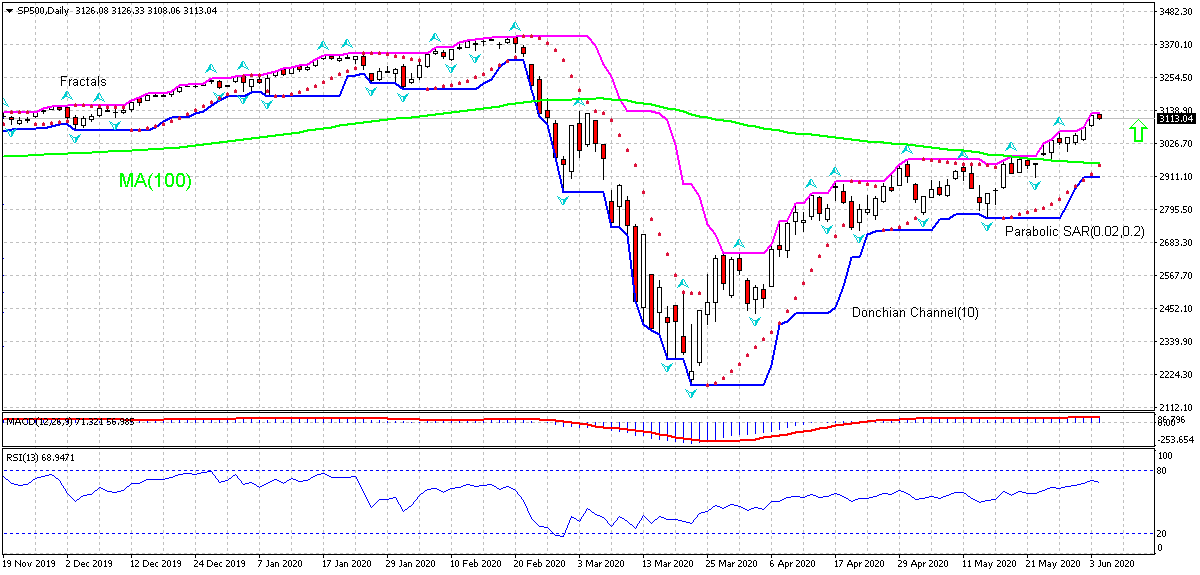
Standard & Poor’s (500), Stock market index Technical Analysis Summary
Atas 3130.30
Buy Stop
Bawah 2907.72
Stop Loss
| Indicator | Signal |
| RSI | Neutral |
| MACD | Buy |
| Donchian Channel | Neutral |
| MA(100) | Buy |
| Fractals | Buy |
| Parabolic SAR | Buy |
Standard & Poor’s (500), Stock market index Chart Analysis
Standard & Poor’s (500), Stock market index Analisis Teknis
On the daily timeframe SP500: D1 has risen above the 100-day moving average MA(100), which is declining. We believe the bullish momentum will continue after the price breaches above the upper boundary of Donchian channel at 3130.30. A level above this can be used as an entry point for placing a pending order to buy. The stop loss can be placed below 2907.72. After placing the order, the stop loss is to be moved every day to the next fractal low, following Parabolic signals. Thus, we are changing the expected profit/loss ratio to the breakeven point. If the price meets the stop loss level (2907.72) without reaching the order (3130.30), we recommend cancelling the order: the market has undergone internal changes which were not taken into account.
Fundamental Analysis Indeks - Standard & Poor’s (500), Stock market index
Economic data from US have been not as bad as feared. Will the SP500 rebound continue?
US economic data in the last couple of weeks were not as bad as feared. US Institute for Supply Management (ISM) report showed its manufacturing index rose to 43.1 in May from an 11-year low of 41.5 in April . And the ISM’s non-manufacturing PMI came in at 45.4 in May, above the consensus forecast of 44.7. Readings above 50.0 indicate sector expansion, below indicate contraction. Furthermore, data from Automatic Data Processing showed private sector employers cut 2.76 million jobs in May, following a decrease of 20.2 million in April. Analysts had expected a drop of 9 million. The better than expected economic data undoubtedly were result of stimulus measures which were expanded in the last couple of months. Thus, a supplementary stimulus package, named Phase 3.5, was signed into law on April 24, 2020 appropriating $484 billion, mostly to replenish the Paycheck Protection Program (PPP) and expanded Economic Injury Disaster Loan (EIDL), and contains additional funding for hospitals and COVID-19 testing. The fiscal and monetary stimulus programs by the Federal Reserve buoyed investors’ confidence, propping the equity market. At the same time the more closely watched Labor Department employment report will be released Friday, and official data painting a picture worse than the one ADP reported is an immediate downside risk for SP500.
Explore our
Trading Conditions
- Spreads from 0.0 pip
- 30,000+ Trading Instruments
- Stop Out Level - Only 10%
Ready to Trade?
Open Account Perhatian:
Tinjauan ini memiliki karakter informatif dan tutorial dan dipublikasikan secara gratis. Semua data, termasuk dalam Tinjauan, diterima dari sumber publik, diakui kurang lebih dapat diandalkan. Apalagi, tidak ada jaminan bahwa informasi yang ditunjukkan penuh dan tepat. tinjauan tidak diperbarui. Keseluruhan informasi dalam setiap tinjauan, termasuk pendapat, indikator, grafik dan hal lainnya, disediakan hanya untuk tujuan pengenalan dan bukan saran keuangan atau rekomendasi. Seluruh teks dan bagiannya, serta grafik tidak dapat dianggap sebagai tawaran untuk membuat kesepakatan dengan aset apa pun. Pasar IFC dan karyawannya dalam kondisi apapun tidak bertanggung jawab atas tindakan yang dilakukan oleh orang lain selama atau setelah membaca tinjauan.

