- Analisis
- Analisis teknis
EUR/CZK Analisis teknis - EUR/CZK Jual beli: 2019-12-11
Preparing for the Czech National Bank's meeting
Weak inflation data for November came out in the Czech Republic. Is there a possibility for the EURCZK to rise?
An upward movement means the weakening of the Czech koruna against the euro. In November 2019, inflation in the Czech Republic increased by 0.3% and reached 3.1% in annual terms, against 2.7% year over year in October 2019. This is the biggest growth since October 2012. Inflation slightly exceeded the Czech National Bank's target range amounting to 2% plus or minus 1%. Tomas Nidetzky, member of the Board of Directors of the Czech National Bank, said that it is advisable to keep the rate at the current level of 2%. Before the publication of the November inflation data, market participants did not exclude a 0.25% rate cut. Earlier, weak data on industrial production and the trade balance for October were published. The Czech GDP in the 3rd quarter of the current year rose by 2.5% year over year, which is 0.2% lower than the official forecast. The next meeting of the Czech National Bank will be held on December 18, 2019.
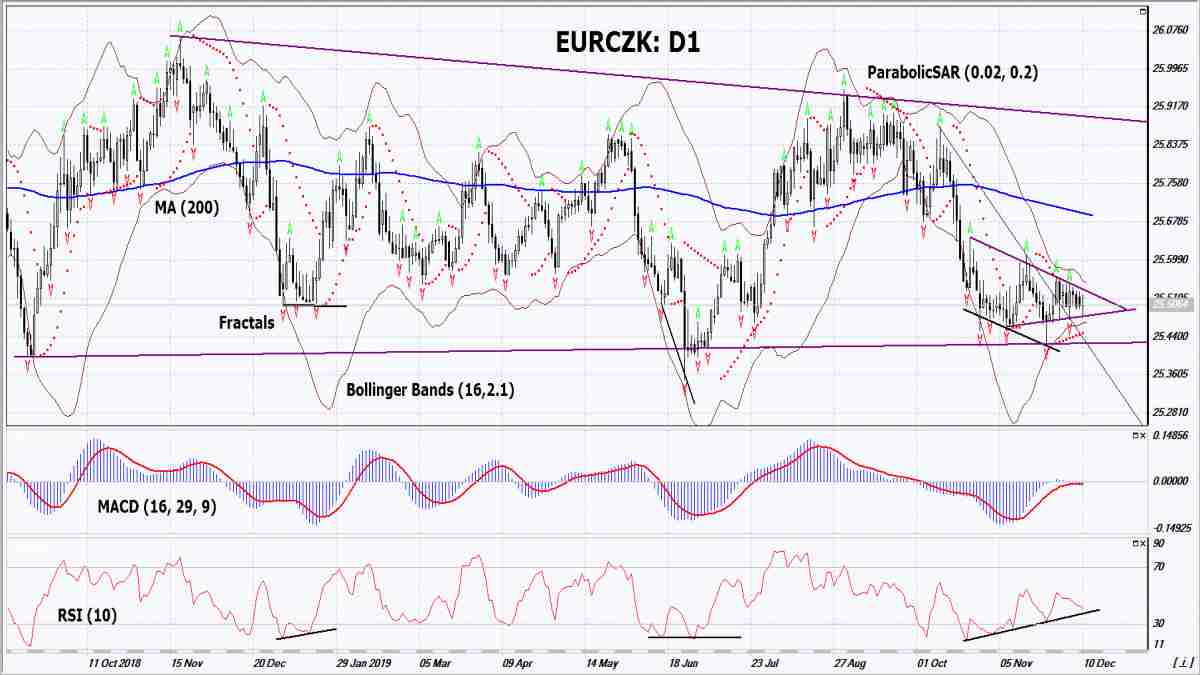
On the daily timeframe, the EURCZK: D1 approached the resistance line of the medium-term neutral trend and formed a triangle. Before opening a buy position, it should be breached up. A number of technical analysis indicators formed buy signals. The further price increase is possible in case of negative economic data in the Czech Republic and positive data in the Eurozone.
- The Parabolic indicator gives a bullish signal.
- The Bollinger bands have narrowed, which indicates low volatility. The lower Bollinger band is titled up.
- The RSI indicator is below 50. It has formed a positive divergence.
- The MACD indicator gives a bullish signal.
The bullish momentum may develop in case EURCZK exceeds its two last fractal highs and the upper Bollinger band at 25.57. This level may serve as an entry point. The initial stop loss may be placed below the support line of the neutral trend, the lower Bollinger band, the two last fractal lows and the Parabolic signal at 25.4. After opening the pending order, we shall move the stop to the next fractal low following the Bollinger and Parabolic signals. Thus, we are changing the potential profit/loss to the breakeven point. More risk-averse traders may switch to the 4-hour chart after the trade and place there a stop loss moving it in the direction of the trade. If the price meets the stop level (25.4) without reaching the order (25.57), we recommend closing the position: the market sustains internal changes that were not taken into account.
Summary of technical analysis
| Position | Buy |
| Buy stop | Above 25.57 |
| Stop loss | Below 25.4 |
- Get Certificate

Perhatian:
Tinjauan ini memiliki karakter informatif dan tutorial dan dipublikasikan secara gratis. Semua data, termasuk dalam Tinjauan, diterima dari sumber publik, diakui kurang lebih dapat diandalkan. Apalagi, tidak ada jaminan bahwa informasi yang ditunjukkan penuh dan tepat. tinjauan tidak diperbarui. Keseluruhan informasi dalam setiap tinjauan, termasuk pendapat, indikator, grafik dan hal lainnya, disediakan hanya untuk tujuan pengenalan dan bukan saran keuangan atau rekomendasi. Seluruh teks dan bagiannya, serta grafik tidak dapat dianggap sebagai tawaran untuk membuat kesepakatan dengan aset apa pun. Pasar IFC dan karyawannya dalam kondisi apapun tidak bertanggung jawab atas tindakan yang dilakukan oleh orang lain selama atau setelah membaca tinjauan.
