- Analisis
- Analisis teknis
FTSE 100 Analisis teknis - FTSE 100 Jual beli: 2019-09-13
Positive data bullish for GB100
UK’s manufacturing output decline was less than expected. Will the GB100 stock index continue advancing?
UK data lately were positive on balance: contraction in manufacturing sector slowed while construction output grew in July. Manufacturing production declined 0.6% over year after 1.4% drop in June, while construction output rose 0.3% after 0.2% decline. And labor market remains strong: data indicated UK jobless rate fell back to lowest since mid-1970 - 3.8% after 3.9% in June. And British lawmakers are opposing Prime Minister Boris Johnson’s actions aimed at leading UK out of European Union without a deal in the end of October. Positive data are bullish for UK’s stock market index.
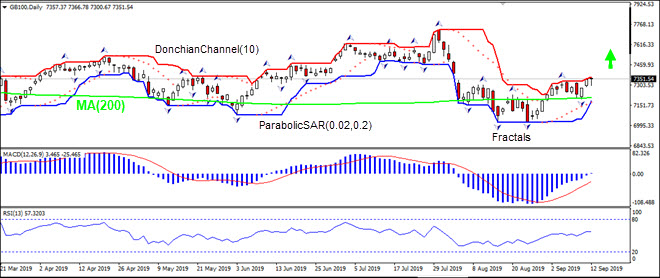
On the daily timeframe GB100: D1 is rising after bouncing off the 200-day moving average MA(200).
- The Donchian channel indicates uptrend: it is narrowing up.
- The Parabolic indicator has formed a buy signal.
- The MACD indicator is about to cross above the signal line and the gap is widening, which is a bullish signal.
- The RSI oscillator is above 50 level but has not reached the overbought zone.
We believe the bullish momentum will continue as the price breaches above the upper boundary of Donchian channel at 7366.78. This level can be used as an entry point for placing a pending order to buy. The stop loss can be placed below the fractal low at 7196.94. After placing the order, the stop loss is to be moved every day to the next fractal low, following Parabolic signals. Thus, we are changing the expected profit/loss ratio to the breakeven point. If the price meets the stop loss level (7196.94) without reaching the order (7366.78), we recommend cancelling the order: the market has undergone internal changes which were not taken into account.
Technical Analysis Summary
| Order | Buy |
| Buy stop | Above 7366.78 |
| Stop loss | Below 7196.94 |
- Get Certificate

Perhatian:
Tinjauan ini memiliki karakter informatif dan tutorial dan dipublikasikan secara gratis. Semua data, termasuk dalam Tinjauan, diterima dari sumber publik, diakui kurang lebih dapat diandalkan. Apalagi, tidak ada jaminan bahwa informasi yang ditunjukkan penuh dan tepat. tinjauan tidak diperbarui. Keseluruhan informasi dalam setiap tinjauan, termasuk pendapat, indikator, grafik dan hal lainnya, disediakan hanya untuk tujuan pengenalan dan bukan saran keuangan atau rekomendasi. Seluruh teks dan bagiannya, serta grafik tidak dapat dianggap sebagai tawaran untuk membuat kesepakatan dengan aset apa pun. Pasar IFC dan karyawannya dalam kondisi apapun tidak bertanggung jawab atas tindakan yang dilakukan oleh orang lain selama atau setelah membaca tinjauan.
