- Analisis
- Analisis teknis
Lean Hog Analisis teknis - Lean Hog Jual beli: 2019-02-15
Farmers hope for the cancellation of duties
US Treasury Secretary Steven Mnuchin said that he was pleased with the progress of the US-China trade negotiations. Will LHOG prices rise?
In April and July 2018, China sharply raised its duties on American pork in response to the increase in duties in the US on Chinese aluminum and other metals. Because of this, the volume of pork exports from the US to China decreased by 55% last year compared with 2017. Theoretically, the normalization of trade relations between the two countries and the cancellation of duties may increase the demand for American pork. An additional factor for the possible growth of quotations may be the registration of new cases of swine fever in Europe and Asia. Amid this, pork exports from Brazil in the first 6 days of February increased by 50% compared with the average daily volume of January and reached 2.8 thousand tons per day.
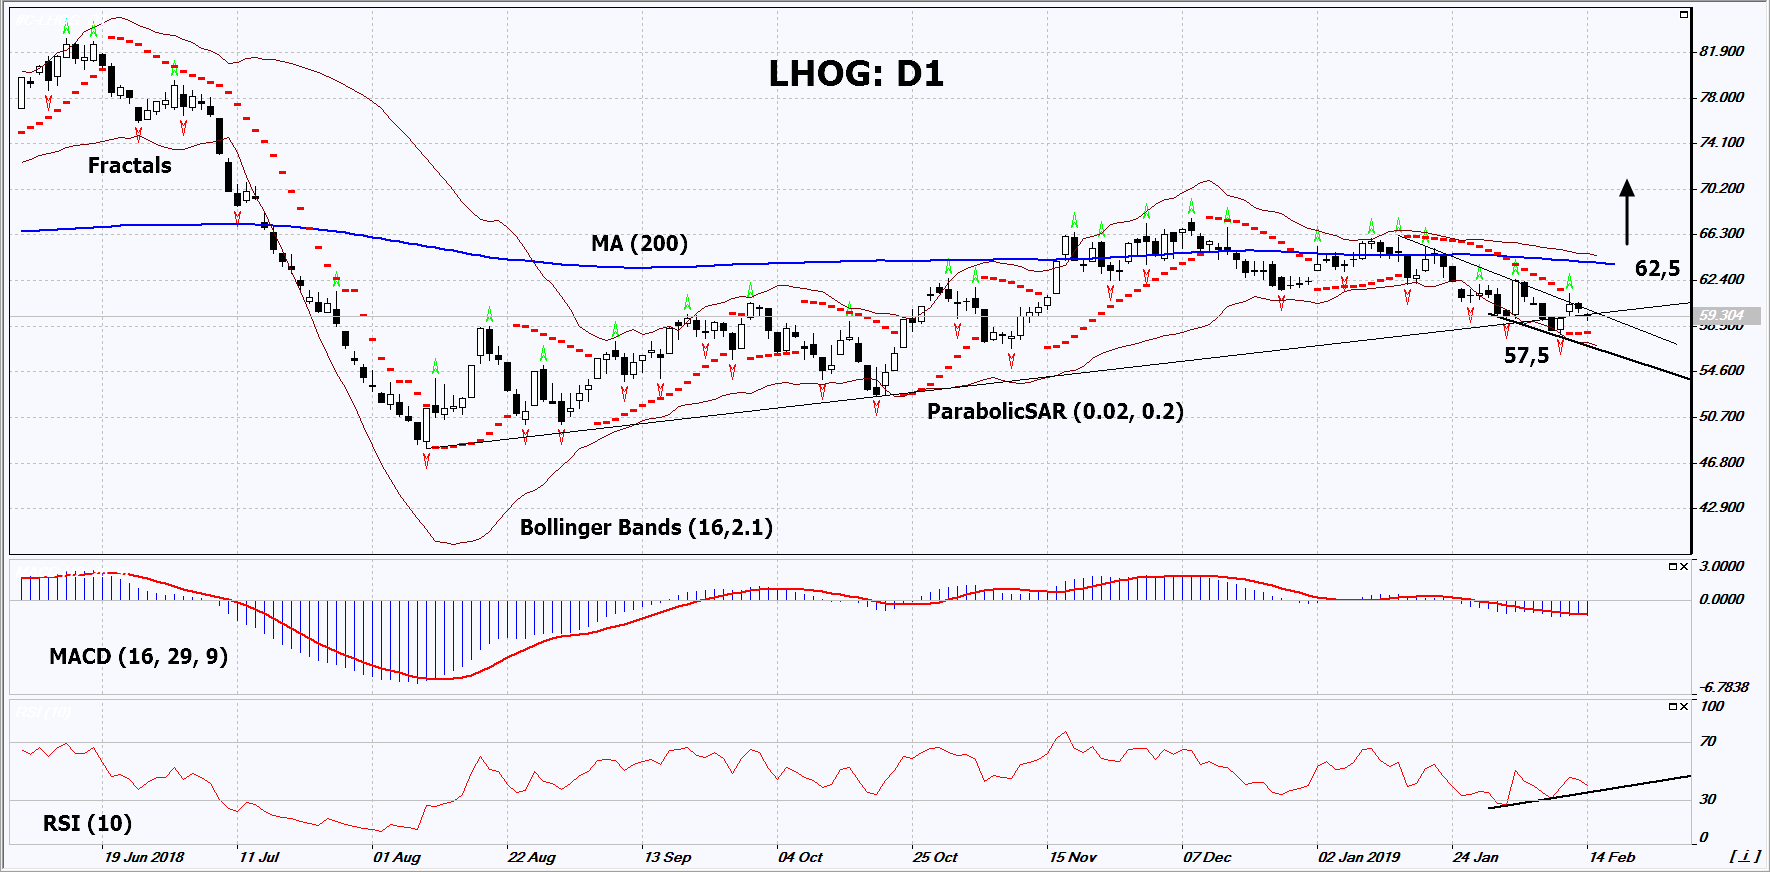
On the daily timeframe, LHOG: D1 is in the support line of the uptrend. A number of technical analysis indicators formed buy signals. The further price increase is possible in case of the cancellation of duties on American pork in China.
- The Parabolic indicator gives a bullish signal.
- The Bollinger bands have widened, which indicates high volatility. Both Bollinger bands are titled down.
- The RSI indicator is below 50. It has formed a positive divergence.
- The MACD indicator gives a bullish signal.
The bullish momentum may develop in case LHOG exceeds its two last fractal hisgs at 62.5. This level may serve as an entry point. The initial stop loss may be placed below the last fractal low and the Parabolic signal at 57.5. After opening the pending order, we shall move the stop to the next fractal low following the Bollinger and Parabolic signals. Thus, we are changing the potential profit/loss to the breakeven point. More risk-averse traders may switch to the 4-hour chart after the trade and place there a stop loss moving it in the direction of the trade. If the price meets the stop level (57.5) without reaching the order (62.5), we recommend to close the position: the market sustains internal changes that were not taken into account.
Summary of technical analysis
| Position | Buy |
| Buy stop | Above 62.5 |
| Stop loss | Below 57.5 |
- Get Certificate

Perhatian:
Tinjauan ini memiliki karakter informatif dan tutorial dan dipublikasikan secara gratis. Semua data, termasuk dalam Tinjauan, diterima dari sumber publik, diakui kurang lebih dapat diandalkan. Apalagi, tidak ada jaminan bahwa informasi yang ditunjukkan penuh dan tepat. tinjauan tidak diperbarui. Keseluruhan informasi dalam setiap tinjauan, termasuk pendapat, indikator, grafik dan hal lainnya, disediakan hanya untuk tujuan pengenalan dan bukan saran keuangan atau rekomendasi. Seluruh teks dan bagiannya, serta grafik tidak dapat dianggap sebagai tawaran untuk membuat kesepakatan dengan aset apa pun. Pasar IFC dan karyawannya dalam kondisi apapun tidak bertanggung jawab atas tindakan yang dilakukan oleh orang lain selama atau setelah membaca tinjauan.
