- Analisis
- Analisis teknis
Gas Alam Analisis teknis - Gas Alam Jual beli: 2019-08-19
The growth of gas reserves slowed down in the USA
The increase in US natural gas reserves over the week was less than expected. Will the NATGAS quotations grow?
According to U.S. Energy Information Administration (EIA), gas reserves for the week increased by 49 billion cubic feet with a forecast of 58 billion. As a result, gas reserves amounted to 2.738 trillion cubic feet, which is 3.9% lower than their average over the past 5 years. According to the EIA, over the past 12 months, total US gas supply has increased by 6% and total demand by 4.6%. The discrepancy is not very large, but at the same time, natural gas quotes are now a quarter lower than last year. They are near multi-year lows. Gas demand may increase amid large-scale plans to increase US exports of liquefied natural gas (LNG). Compared to last year, LNG deliveries abroad have already increased by 11%. US natural gas production is now at a historic high, but there is a risk of its decline. According to Baker Hughes, the number of operating drilling rigs in gas production in the United States has declined to a minimum since 2017 and amounted to 165 units.
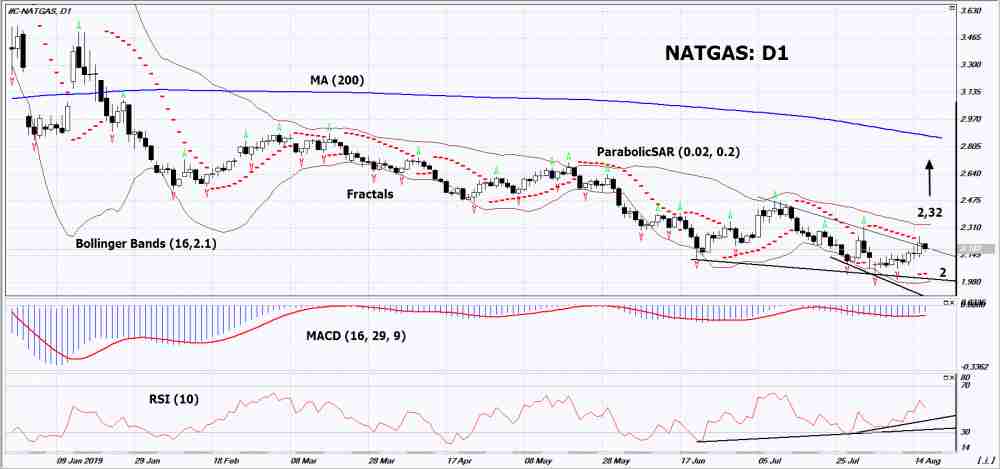
On the daily timeframe Natgas: D1 has broken up the resistance line of the downtrend and is adjusted up. Various technical analysis indicators have generated signals to increase. Further growth of quotations is possible in case of increased demand in the US and the massive closure of short positions.
- The Parabolic indicator demonstrates a signal to increase.
- The Bolinger bands narrowed, indicating a volatility decrease. Both Bollinger Lines Slope Up.
- The RSI indicator is above the 50 mark. It has formed a divergence to increase.
- The MACD indicator gives a bullish signal.
The bullish momentum may develop if Natgas exceeds its last upper fractal and the upper Bollinger line: 2.32. This level can be used as an entry point. The initial stop lose may be placed below the last two lower fractals, the lower Bollinger line, the minimum since April 2016 and the Parabolic signal: 2. After opening a pending order, the stop shall be moved following the Bollinger and Parabolic signals to the next fractal minimum. Thus, we are changing the potential profit/loss to the breakeven point. More risk-averse traders may switch to the 4-hour chart after the trade and place a stop loss moving it in the direction of the trade. If the price meets the stop level (2) without reaching the order (2,32), we recommend to cancel the order: the market sustains internal changes that were not taken into account.
Technical Analysis Summary
| Position | Buy |
| Buy stop | Above 2,32 |
| Stop loss | Below 2 |
- Get Certificate

Perhatian:
Tinjauan ini memiliki karakter informatif dan tutorial dan dipublikasikan secara gratis. Semua data, termasuk dalam Tinjauan, diterima dari sumber publik, diakui kurang lebih dapat diandalkan. Apalagi, tidak ada jaminan bahwa informasi yang ditunjukkan penuh dan tepat. tinjauan tidak diperbarui. Keseluruhan informasi dalam setiap tinjauan, termasuk pendapat, indikator, grafik dan hal lainnya, disediakan hanya untuk tujuan pengenalan dan bukan saran keuangan atau rekomendasi. Seluruh teks dan bagiannya, serta grafik tidak dapat dianggap sebagai tawaran untuk membuat kesepakatan dengan aset apa pun. Pasar IFC dan karyawannya dalam kondisi apapun tidak bertanggung jawab atas tindakan yang dilakukan oleh orang lain selama atau setelah membaca tinjauan.
