- Analisis
- Analisis teknis
NZD/USD Analisis teknis - NZD/USD Jual beli: 2017-03-21
Awaiting meeting of Reserve Bank of New Zealand
This Wednesday the next Reserve Bank of New Zealand meeting will take place while the national external trade data for February 2017 will come out on Thursday. The preliminary forecasts are positive. Will New Zealand dollar continue advancing?
Market participants believe the external trade balance for February shall come out positive for the first time since last June being NZ$160mln. This may support the trend of improving economic indicators. The current account deficit for Q4 2016 came out last week in New Zealand. It was record high in the recent 2 years. Year over the year the indicator fell from 3% to 2.7% of the GDP. Experts expect the Reserve Bank of New Zealand to keep the current rate of 1.75% on its meeting on March 22, 2017.
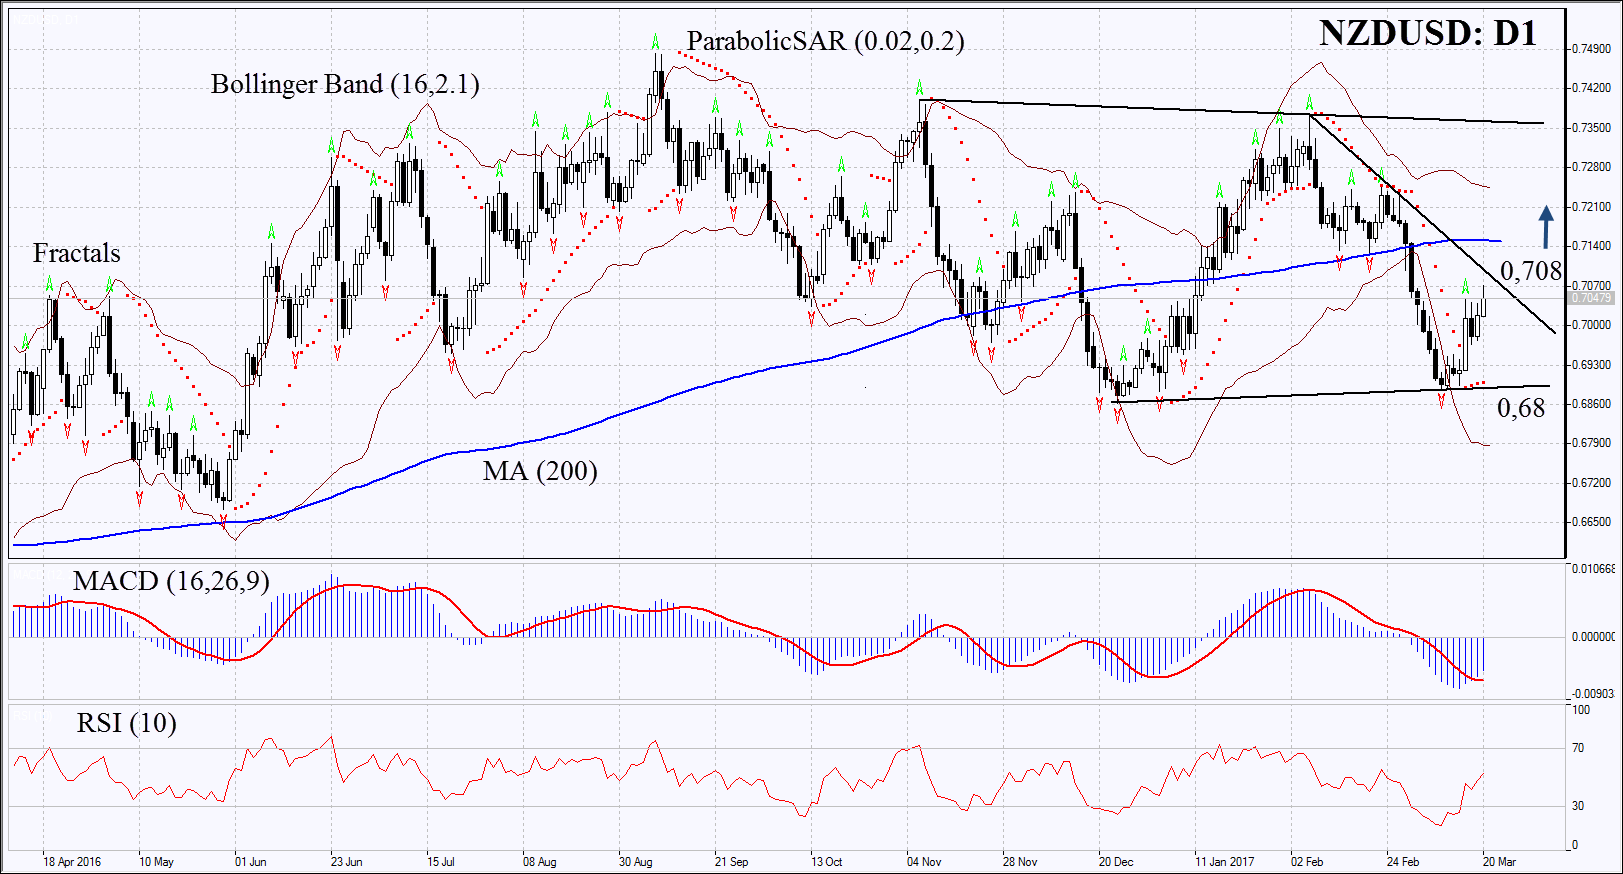
On the daily chart NZDUSD: D1 is rising within the neutral channel. Its further increase is possible in case of strong external trade data and positive comments on the state of New Zealand’s economy from the RBNZ.
- The Parabolic indicator gives bullish signal.
- The Bollinger bands have widened a lot which means higher volatililty.
- The RSI is above 50. No divergence.
- The MACD gives bullish signal.
The bullish momentum may develop in case NZDUSD surpasses the last fractal high at 0.708. This level may serve the point of entry. The initial stop-loss may be placed below the last fractal low and the Parabolic signal at 0.688. Having opened the pending order we shall move the stop to the next fractal low following the Parabolic and Bollinger signals. Thus, we are changing the probable profit/loss ratio to the breakeven point. The most risk-averse traders may switch to the 4-hour chart after the trade and place there a stop-loss moving it in the direction of the trade. If the price meets the stop-loss level at 0.688 without reaching the order at 0.708, we recommend cancelling the position: the market sustains internal changes which were not taken into account.
Summary of technical analysis
| Position | Buy |
| Buy stop | above 0.708 |
| Stop loss | below 0.688 |
- Get Certificate

Perhatian:
Tinjauan ini memiliki karakter informatif dan tutorial dan dipublikasikan secara gratis. Semua data, termasuk dalam Tinjauan, diterima dari sumber publik, diakui kurang lebih dapat diandalkan. Apalagi, tidak ada jaminan bahwa informasi yang ditunjukkan penuh dan tepat. tinjauan tidak diperbarui. Keseluruhan informasi dalam setiap tinjauan, termasuk pendapat, indikator, grafik dan hal lainnya, disediakan hanya untuk tujuan pengenalan dan bukan saran keuangan atau rekomendasi. Seluruh teks dan bagiannya, serta grafik tidak dapat dianggap sebagai tawaran untuk membuat kesepakatan dengan aset apa pun. Pasar IFC dan karyawannya dalam kondisi apapun tidak bertanggung jawab atas tindakan yang dilakukan oleh orang lain selama atau setelah membaca tinjauan.
