- Analisis
- Analisis teknis
Kedelai Analisis teknis - Kedelai Jual beli: 2019-05-03
High US supply expectations bearish for soybean prices
High US soybean supply estimate is expected to be reported in May WASDE report. Will the soybean prices continue declining?
The USDA is expected to report high soybean supply in its monthly World Agricultural Supply and Demand Estimate to be released on May 10. And while China and US negotiators appear close to reaching a trade deal, China’s import demand appears significantly impaired as African swine fever devastated the country’s hog industry: China’s imports through March were down 17% from year-ago levels. And weather patterns point to increasing likelihood of high US soybean yields contributing to a record crop for seventh year in a row as El Nino extends into autumn. Higher supply estimates are bearish for soybean.
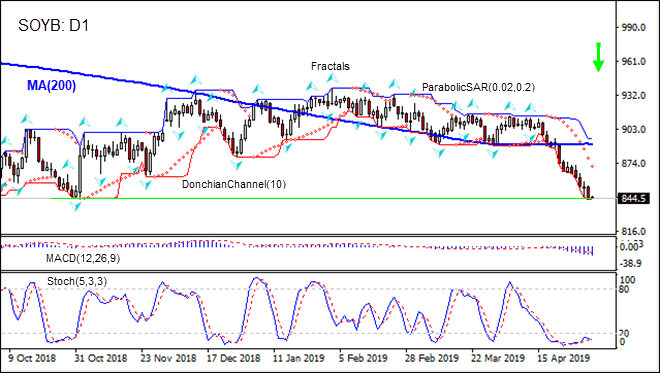
On the daily timeframe the SOYB: D1 is below the 200-day moving average MA(200) which is flat.
- The Parabolic indicator gives a sell signal.
- The Donchian channel indicates no trend yet: it is flat.
- The MACD indicator gives a bearish signal: it is below the signal line and the gap is widening.
- The Stochastic oscillator is in the oversold zone, this is bullish.
We believe the bearish momentum will continue after the price breaches below the lower boundary of Donchian channel at 843.3. This level can be used as an entry point for placing a pending order to sell. The stop loss can be placed above the upper Donchian boundary at 894.9. After placing the order, the stop loss is to be moved every day to the next fractal high, following Parabolic signals. Thus, we are changing the expected profit/loss ratio to the breakeven point. If the price meets the stop loss level (894.9) without reaching the order (843.3), we recommend cancelling the order: the market has undergone internal changes which were not taken into account.
Technical Analysis Summary
| Position | Sell |
| Sell stop | Below 843.3 |
| Stop loss | Above 894.9 |
- Get Certificate

Perhatian:
Tinjauan ini memiliki karakter informatif dan tutorial dan dipublikasikan secara gratis. Semua data, termasuk dalam Tinjauan, diterima dari sumber publik, diakui kurang lebih dapat diandalkan. Apalagi, tidak ada jaminan bahwa informasi yang ditunjukkan penuh dan tepat. tinjauan tidak diperbarui. Keseluruhan informasi dalam setiap tinjauan, termasuk pendapat, indikator, grafik dan hal lainnya, disediakan hanya untuk tujuan pengenalan dan bukan saran keuangan atau rekomendasi. Seluruh teks dan bagiannya, serta grafik tidak dapat dianggap sebagai tawaran untuk membuat kesepakatan dengan aset apa pun. Pasar IFC dan karyawannya dalam kondisi apapun tidak bertanggung jawab atas tindakan yang dilakukan oleh orang lain selama atau setelah membaca tinjauan.
