- Analisis
- Analisis teknis
Gula Analisis teknis - Gula Jual beli: 2017-02-14
Global sugar surplus expected this season
Participants of Dubai Sugar Conference expect sugar surplus in season 2017/2018 which started in last October. Tropical Research Services Agency estimates it to be in the range of 1-3mln tonnes. Will sugar prices edge lower?
The global sugar deficit of 8.3mln tonnes was recorded in season 2016/2017 and of 6.6mln tonnes in season 2015/16, according to Tropical Research Services. Mainly due to this sugar prices rose in global markets more than twofold since October 2015 to October 2016. The downward correction is probable given the global surplus. Forecasts say that global sugar production will reach 187.14mln tonnes in 2017/18 compared to 174.9mln tonnes in previous season. Global consumption is expected to reach 185.78mln tonnes, up from 183.2mln tonnes in previous season. The main risk for global sugar prices to get lower is the possible decline in its production in India.
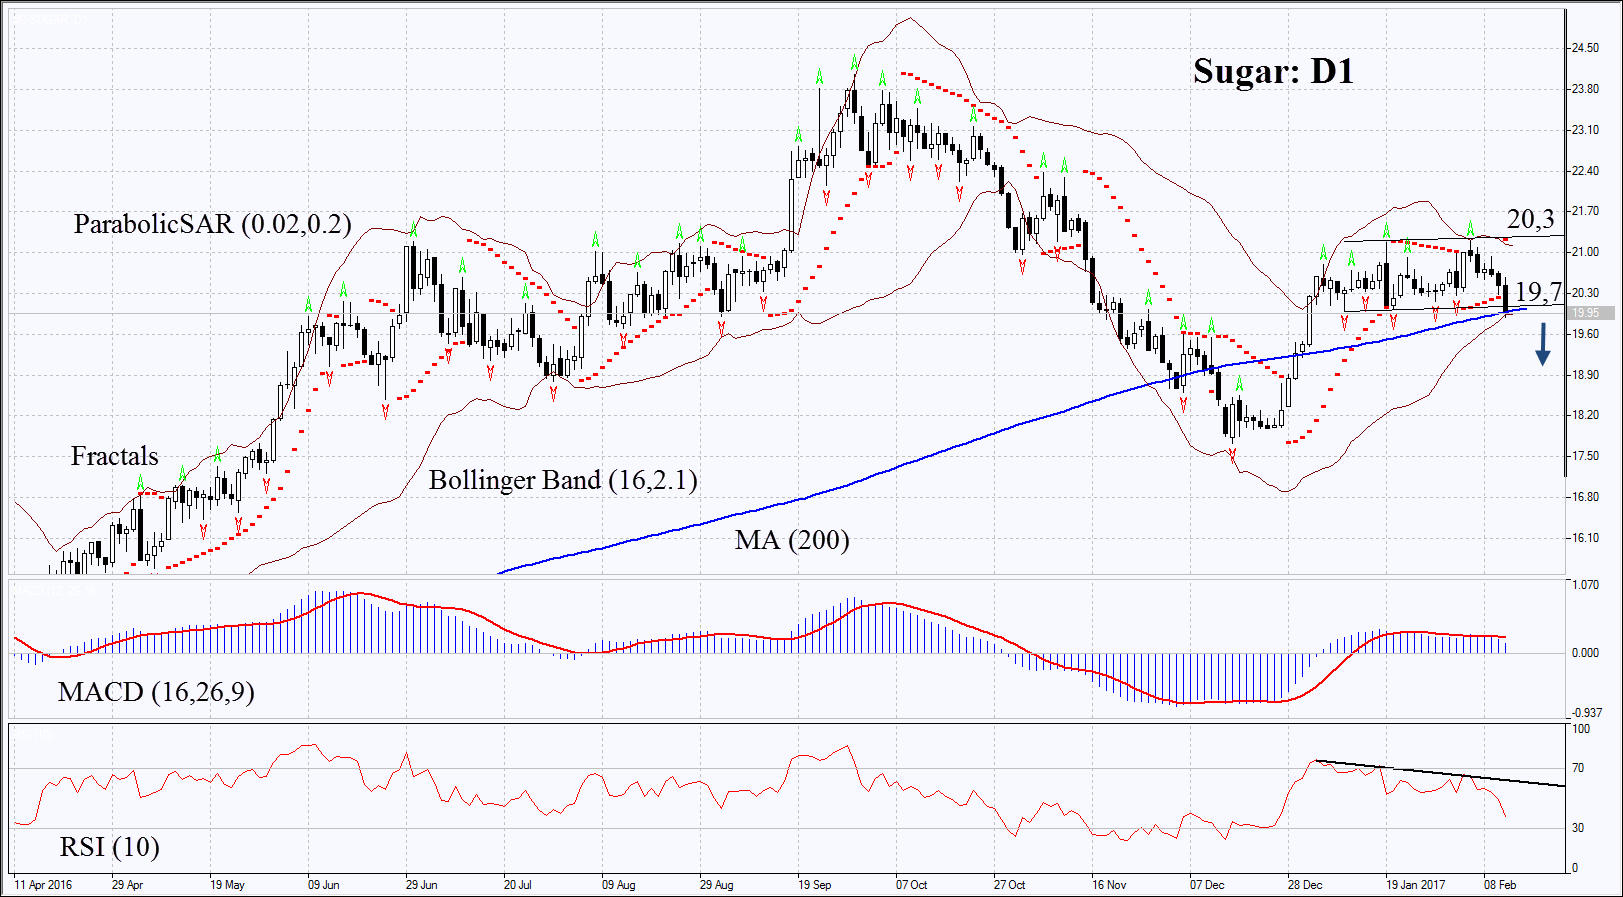
On the daily chart Sugar: D1 is struggling to break down from the neutral trend. Its further decline is probable in case of improved crop forecast in India and other countries.
- The Parabolic indicator gives bearish signal.
- The Bollinger bands have narrowed which means lower volatility.
- The RSI is below 50. It has formed slight negative divergence.
- The MACD gives bearish signals.
The bearish momentum may develop in case Sugar falls below the 200-day moving average, lower boundary of the neutral range and the Bollinger band at 19.7. This level may serve the point of entry. The initial stop-loss may be placed above the Parabolic signal, the last fractal high and the upper Bollinger band at 20.3. Having opened the pending order we shall move the stop to the next fractal high following the Parabolic and Bollinger signals. Thus, we are changing the probable profit/loss ratio to the breakeven point. The most risk-averse traders may switch to the 4-hour chart after the trade and place there a stop-loss moving it in the direction of the trade. If the price meets the stop-loss level at 20.3 without reaching the order at 19.7, we recommend cancelling the position: the market sustains internal changes which were not taken into account.
Summary of technical analysis
| Position | Sell |
| Sell stop | below 19.7 |
| Stop loss | above 20.3 |
- Get Certificate

Perhatian:
Tinjauan ini memiliki karakter informatif dan tutorial dan dipublikasikan secara gratis. Semua data, termasuk dalam Tinjauan, diterima dari sumber publik, diakui kurang lebih dapat diandalkan. Apalagi, tidak ada jaminan bahwa informasi yang ditunjukkan penuh dan tepat. tinjauan tidak diperbarui. Keseluruhan informasi dalam setiap tinjauan, termasuk pendapat, indikator, grafik dan hal lainnya, disediakan hanya untuk tujuan pengenalan dan bukan saran keuangan atau rekomendasi. Seluruh teks dan bagiannya, serta grafik tidak dapat dianggap sebagai tawaran untuk membuat kesepakatan dengan aset apa pun. Pasar IFC dan karyawannya dalam kondisi apapun tidak bertanggung jawab atas tindakan yang dilakukan oleh orang lain selama atau setelah membaca tinjauan.
