- Analisis
- Analisis teknis
USD/CAD Analisis teknis - USD/CAD Jual beli: 2017-09-25
Preparing for the publication of the GDP data
On Friday, September 22, 2017, the August inflation data were published in Canada. Its increase was less than forecasted, which reduced the chances of Bank of Canada’s rate hike at its next meeting on October 25, 2017. Will the USDCAD prices grow?
Their growth means the weakening of the Canadian dollar against the US dollar. Currently, according to the interest rate swap quotes, the probability of Bank of Canada's rate hike at its October meeting is 41%. Its current level is 1%, which is below the Fed rate of 1.25%. Note that the probability of the Fed rate hike at the next meeting in December 2017 is close to 70%. This week two important events are expected in Canada which may affect the dynamics of the Canadian dollar. On Wednesday, the press conference of the head of Bank of Canada Stefan Poloz is expected. On Friday, the data on Canada GDP for July will come out. According to forecasts, its growth will slow down both in annual and monthly terms.
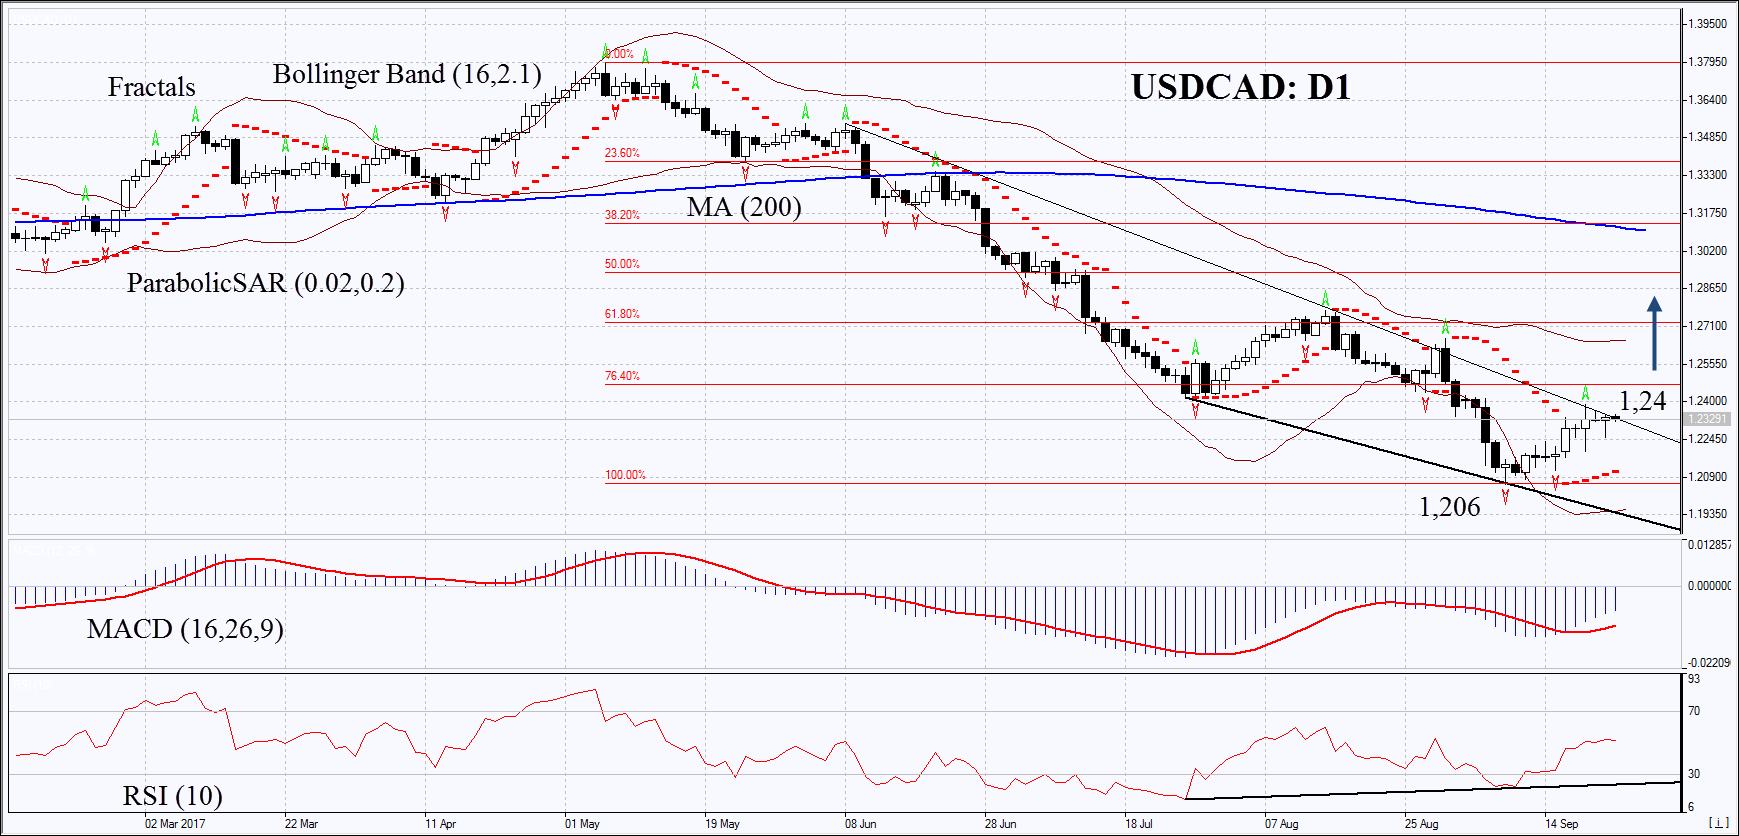
On the daily timeframe, USDCAD: D1 approached the resistance line of the downtrend. In order to open a buy position, it needs to be overcome. The further price increase is possible in case of the publication of weak Canadian economic data and Bank of Canada’s refusal to raise the rate.
- The Parabolic indicator gives a bullish signal.
- The Bollinger bands have widened, which means higher volatility. They are tilted upwards.
- The RSI indicator is below 50. It has formed a positive divergence.
- The MACD indicator gives a bullish signal.
The bullish momentum may develop in case USDCAD exceeds the previous fractal high at 1.24. This level may serve as an entry point. The initial stop loss may be placed below the two fractal lows, the 2.5-year low and the Parabolic signal at 1.206. After opening the pending order, we shall move the stop to the next fractal low following the Bollinger and Parabolic signals. Thus, we are changing the potential profit/loss to the breakeven point. More risk-averse traders may switch to the 4-hour chart after the trade and place there a stop loss moving it in the direction of the trade. If the price meets the stop level at 1.206 without reaching the order at 1.24 we recommend cancelling the position: the market sustains internal changes that were not taken into account.
Summary of technical analysis
| Position | Buy |
| Buy stop | above 1,24 |
| Stop loss | below 1,206 |
- Get Certificate

Perhatian:
Tinjauan ini memiliki karakter informatif dan tutorial dan dipublikasikan secara gratis. Semua data, termasuk dalam Tinjauan, diterima dari sumber publik, diakui kurang lebih dapat diandalkan. Apalagi, tidak ada jaminan bahwa informasi yang ditunjukkan penuh dan tepat. tinjauan tidak diperbarui. Keseluruhan informasi dalam setiap tinjauan, termasuk pendapat, indikator, grafik dan hal lainnya, disediakan hanya untuk tujuan pengenalan dan bukan saran keuangan atau rekomendasi. Seluruh teks dan bagiannya, serta grafik tidak dapat dianggap sebagai tawaran untuk membuat kesepakatan dengan aset apa pun. Pasar IFC dan karyawannya dalam kondisi apapun tidak bertanggung jawab atas tindakan yang dilakukan oleh orang lain selama atau setelah membaca tinjauan.
