- Analisis
- Analisis teknis
USD/CAD Analisis teknis - USD/CAD Jual beli: 2017-12-27
Preparing for the Bank of Canada meeting
World oil prices continue to rise. Will the Canadian dollar quotes strengthen? On the USDCAD chart, this looks like a decline.
Hydrocarbons account for about a quarter of the Canadian exports. Their price growth improves the performance of the Canadian economy and contributes to the strengthening of the national currency. Brent oil price reached $66 per barrel after a report on the explosion of the pipeline in Libya, which supplies the oil terminal Es Sider. Since early 2017, Brent prices have grown by 17%. The Canadian dollar rose by 5.6% against the US dollar for the same period. An additional positive factor for the Canadian dollar may be an increase in the Bank of Canada rate at its regular meeting on January 17, 2018. Inflation for November reached 2.1% in annual terms, while its target level is 2% plus/minus 1%. The same inflation level was observed in January 2017, after which the Bank of Canada hiked the rates twice in July and September. Its current rate is 1%. It is below the US Fed’s rate range of 1.25-1.5%. Significant economic data in Canada will be published from January 2, 2018 when the Manufacturing PMI for December is released. Till the Bank of Canada meeting, there will be quite a lot of data, which may affect the rate decision. Currently the probability of its growth is estimated at about 60%.
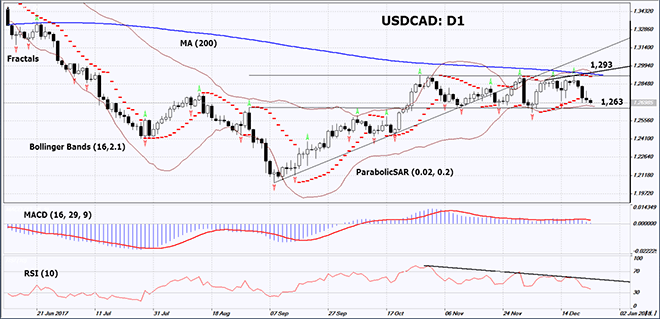
On the daily timeframe, USDCAD: D1 switched from the rising to neutral trend. A downward correction is possible in case of the Bank of Canada rate hike.
- The Parabolic indicator gives a bearish signal.
- The Bollinger bands have narrowed, which means lower volatility. They are tilted down.
- The RSI indicator is below 50. It has formed a negative divergence.
- The MACD indicator gives a bearish signal.
The bearish momentum may develop in case USDCAD drops below the two last fractal lows, the lower Bollinger band and the support line of the neutral range at 1.263. This level may serve as an entry point. The initial stop loss may be placed above the last fractal high, the upper Bollinger band, the 200-day moving average line, the resistance line of the neutral range and the Parabolic signal at 1.293. After opening the pending order, we shall move the stop to the next fractal high following the Bollinger and Parabolic signals. Thus, we are changing the potential profit/loss to the breakeven point. More risk-averse traders may switch to the 4-hour chart after the trade and place there a stop loss moving it in the direction of the trade. If the price meets the stop level at 1.293 without reaching the order at 1.263, we recommend cancelling the position: the market sustains internal changes that were not taken into account.
Summary of technical analysis
| Position | Sell |
| Sell stop | below 1,263 |
| Stop loss | above 1,293 |
- Get Certificate

Perhatian:
Tinjauan ini memiliki karakter informatif dan tutorial dan dipublikasikan secara gratis. Semua data, termasuk dalam Tinjauan, diterima dari sumber publik, diakui kurang lebih dapat diandalkan. Apalagi, tidak ada jaminan bahwa informasi yang ditunjukkan penuh dan tepat. tinjauan tidak diperbarui. Keseluruhan informasi dalam setiap tinjauan, termasuk pendapat, indikator, grafik dan hal lainnya, disediakan hanya untuk tujuan pengenalan dan bukan saran keuangan atau rekomendasi. Seluruh teks dan bagiannya, serta grafik tidak dapat dianggap sebagai tawaran untuk membuat kesepakatan dengan aset apa pun. Pasar IFC dan karyawannya dalam kondisi apapun tidak bertanggung jawab atas tindakan yang dilakukan oleh orang lain selama atau setelah membaca tinjauan.
