- Analisis
- Analisis teknis
Palladium Analisis teknis - Palladium Jual beli: 2019-10-18
Rising car sales bullish for XPDUSD
EU car sales grew strongly in September. Will the XPDUSD continue gaining?
Palladium is one of three precious metals together with platinum and rhodium used in catalytic converters for car exhausts. And more than 80 percent of the world's palladium is used in the catalytic converters that help vehicles reduce their pollutant output. Sales of new passenger cars in the European Union rose sharply in September compared to a year earlier - the car industry association in European Union, ACEA, reported on Wednesday care sales increased by 14.5% to nearly 1.25 million cars in EU. Double-digit growth was recorded in four of the five major car markets. Increasing demand for catalytic converters is bullish for XPDUSD.
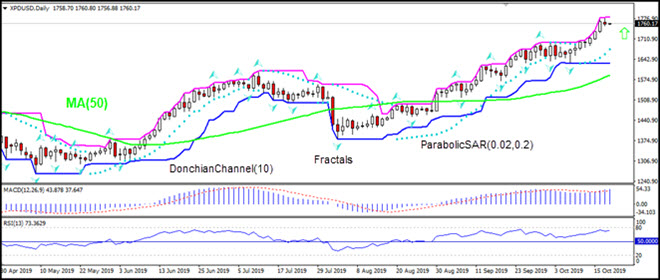
On the daily timeframe the XPDUSD: D1 is rising above the 50-day moving average MA(50).
- The Parabolic indicator gives a buy signal.
- The Donchian channel indicates uptrend: it is widening up.
- The MACD indicator gives a bullish signal: it is above the signal line and the gap is widening.
- The RSI oscillator is near the overbought zone but has not crossed into it.
We believe the bullish momentum will continue after the price breaches above the upper boundary of Donchian channel at 1781.87. This level can be used as an entry point for placing a pending order to buy. The stop loss can be placed below the lower Donchian boundary at 103.86. After placing the order, the stop loss is to be moved every day to the next fractal low, following Parabolic signals. Thus, we are changing the expected profit/loss ratio to the breakeven point. If the price meets the stop loss level (1628.79) without reaching the order (1781.87), we recommend cancelling the order: the market has undergone internal changes which were not taken into account.
Technical Analysis Summary
| Order | Buy |
| Buy stop | Above 1781.87 |
| Stop loss | Below 1628.79 |
- Get Certificate

Perhatian:
Tinjauan ini memiliki karakter informatif dan tutorial dan dipublikasikan secara gratis. Semua data, termasuk dalam Tinjauan, diterima dari sumber publik, diakui kurang lebih dapat diandalkan. Apalagi, tidak ada jaminan bahwa informasi yang ditunjukkan penuh dan tepat. tinjauan tidak diperbarui. Keseluruhan informasi dalam setiap tinjauan, termasuk pendapat, indikator, grafik dan hal lainnya, disediakan hanya untuk tujuan pengenalan dan bukan saran keuangan atau rekomendasi. Seluruh teks dan bagiannya, serta grafik tidak dapat dianggap sebagai tawaran untuk membuat kesepakatan dengan aset apa pun. Pasar IFC dan karyawannya dalam kondisi apapun tidak bertanggung jawab atas tindakan yang dilakukan oleh orang lain selama atau setelah membaca tinjauan.
